
PPF, PPFD, and DLI are all important parameters of a horticulture growth system.
- LED Component Level – Photosynthetic Photon Flux - PPF (μmol/s)
- Luminaire Lighting System Level – Photosynthetic Photon Flux Density - PPFD (μmol/s/m2)
- Operations Level – Daily Light Integral - DLI (mol/m2/day)
Luminus is an LED component manufacturer and can provide the most detailed information about the operating characteristics of our LEDs. In this article we will discuss strategies for using LED component metrics to do a preliminary system design and calculate PPF, PPFD, and DLI for a hypothetical growth facility.
Luminus has an online Horticulture Calculator that provides data for LEDs under different drive conditions. The Horticulture Calculator was designed to model combinations of LEDs and calculate the metrics needed for DLC Horticulture certification. Requests for adding or updating components in Luminus online calculators should be sent to techsupport@luminus.com.
PPF - Photosynthetic Photon Flux
Photosynthetic Photon Flux [μmol/s] is analogous to lumens in conventional LED nomenclature. Lumens are calculated by measuring the spectral power distribution (SPD) in a spectrometer/integrating sphere and multiplying each wavelength bin by the eye response function. The sum of this curve is the lumens for that device.
PPF is also a calculated value based on the same SPD data measured by a spectrometer. To calculate PPF, the spectral power measurements are first converted to photon flux units (μmol/s) and then multiplied by the Photosynthetic Active Radiation (PAR) weighting function. PAR covers wavelengths of light in the visible range between 400nm and 700nm where PAR(λ) has the value of 1.0 and is zero elsewhere.
It is not difficult to do these calculations. We will use the Luminus Horticulture Calculator to illustrate.
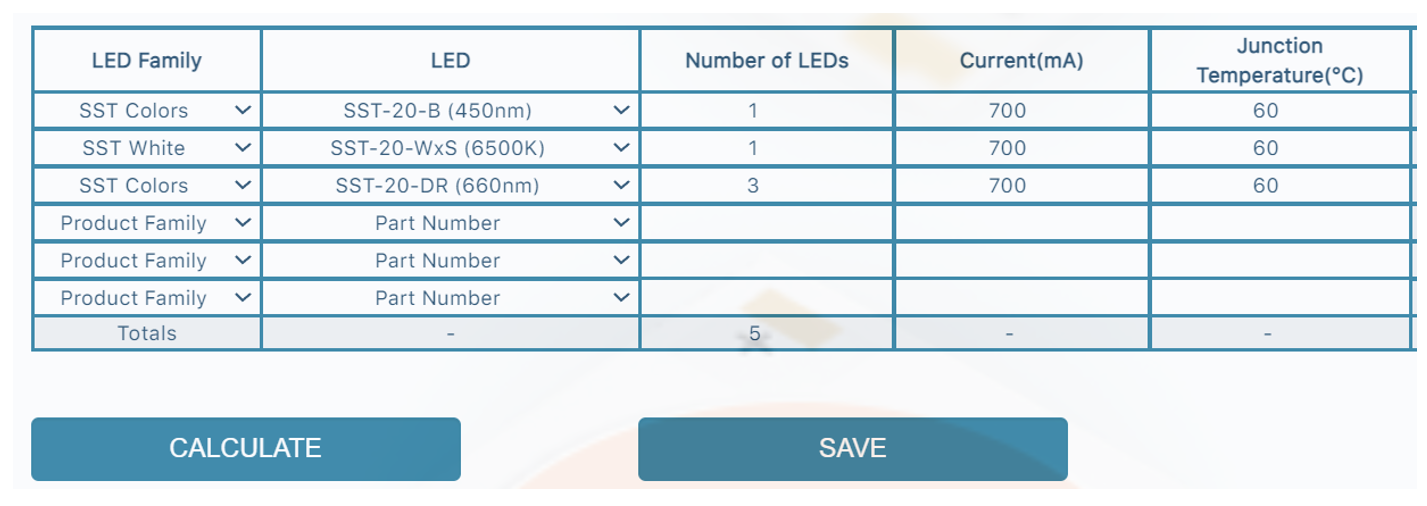
Calculator input. This is a typical 5 LED component “unit cell” specification for general purpose vegetative growth.
We have set the current and temperature to equal values to simulate a unit cell with series connections that can be combined in series-parallel layouts in the rest of the grow light fixture.
The temperature is the junction temperature. LED design projects should always start with a target junction temperature and calculate the BOS thermal components needed to achieve this goal. LED junction temperature has a strong effect on PPF output stability over time and lower temperature values are recommended. We also recommend under driving the LEDs to achieve the demanding efficacy standards typical in the horticulture market.
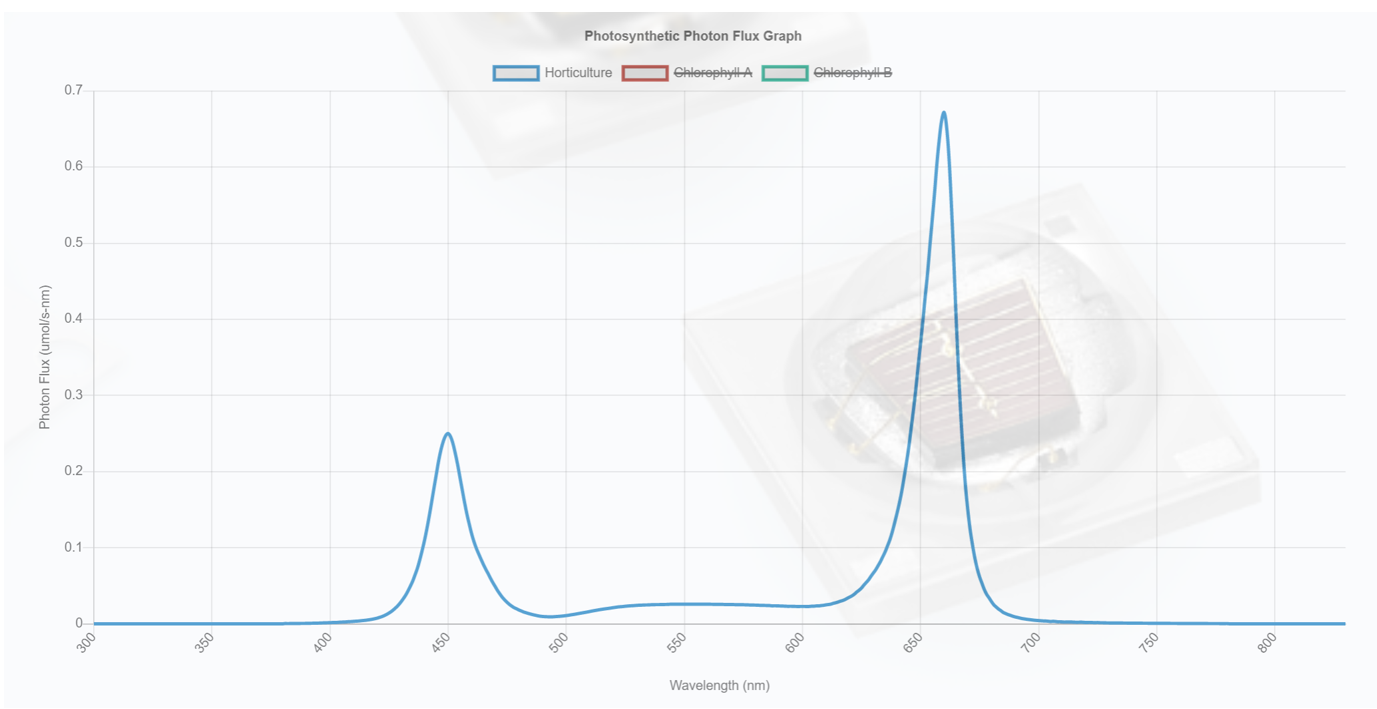
PPF plot. Green light is beneficial for both growth quality and the reduction of eye strain but is often limited to dilute amounts in “purple” lights to improve per unit energy veg biomass growth.
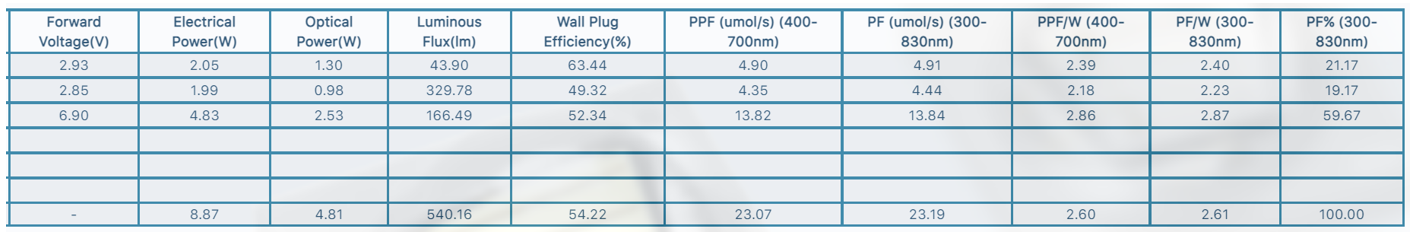
Summary Data for the B, W, R LEDs as well as the summation. The PPF/W (aka μmol/J) column is an important metric for DLC qualification. In this case it is 2.6 PPF/W.
Here we see that the red chip has the best efficacy, followed by the blue chip, then the white chip. This is normal. The difference between red and blue is because red photons have lower energy than blue photons, so they have a higher number of μmol on a per joule basis. The white LED has a lower efficiency because it has a phosphor converting blue photons to achieve a white appearance.
Under driving LEDs has the strongest effect on improving efficacy. Raising the junction temperature often lowers the forward voltage more than accompanying loss of photon output so it tends to increase efficacy - but raising the junction temperature too much will decrease output stability over time and require an earlier fixture replacement cycle.
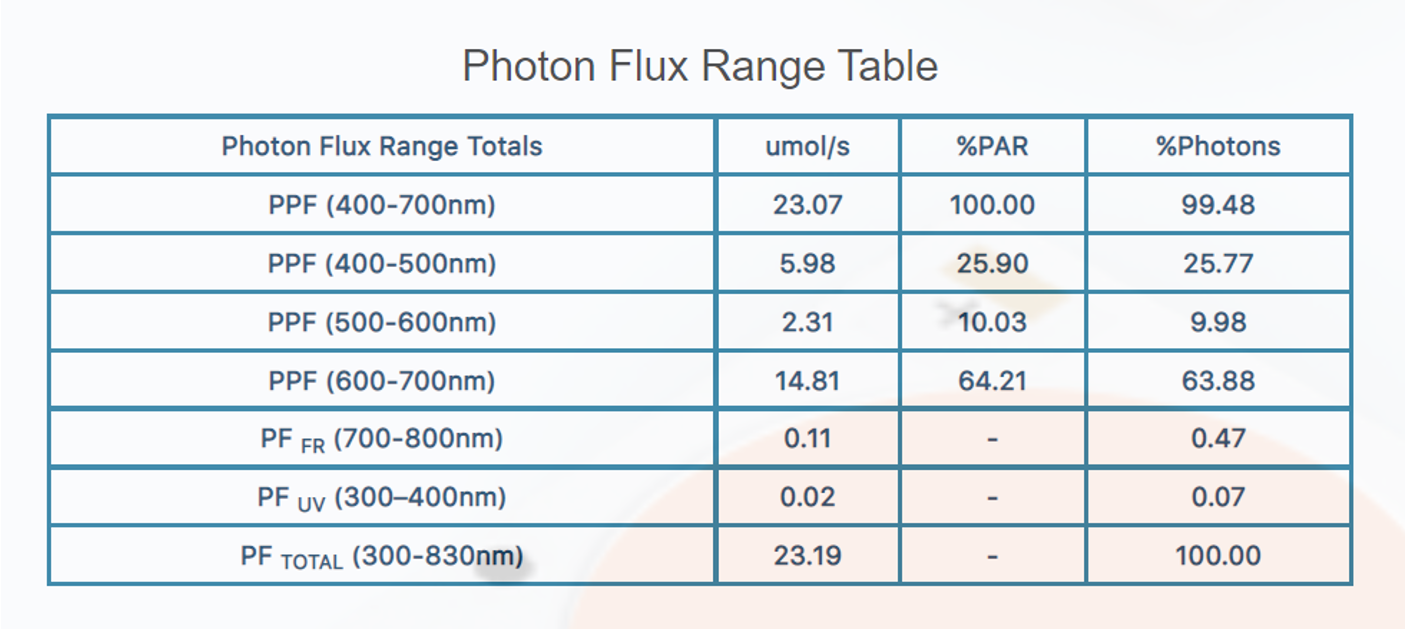
Summary data for the DLC wavelength bins. This table is required by DLC and is a useful tool for matching spectral content requirements supplied by an end user.
If you login to the calculator, you can download a CSV file with the same information by clicking the save button.
We have attached an Excel file that shows how to do the calculations to extract the LED SPD (in watts) and calculate lumens using the PPF data in the csv file. The added content to the CSV data is highlighted in blue. We see that if we have tabular data for any of these curves, SPD, PPF, Lumens, as a function of wavelength, it is easy to convert to the other curves.
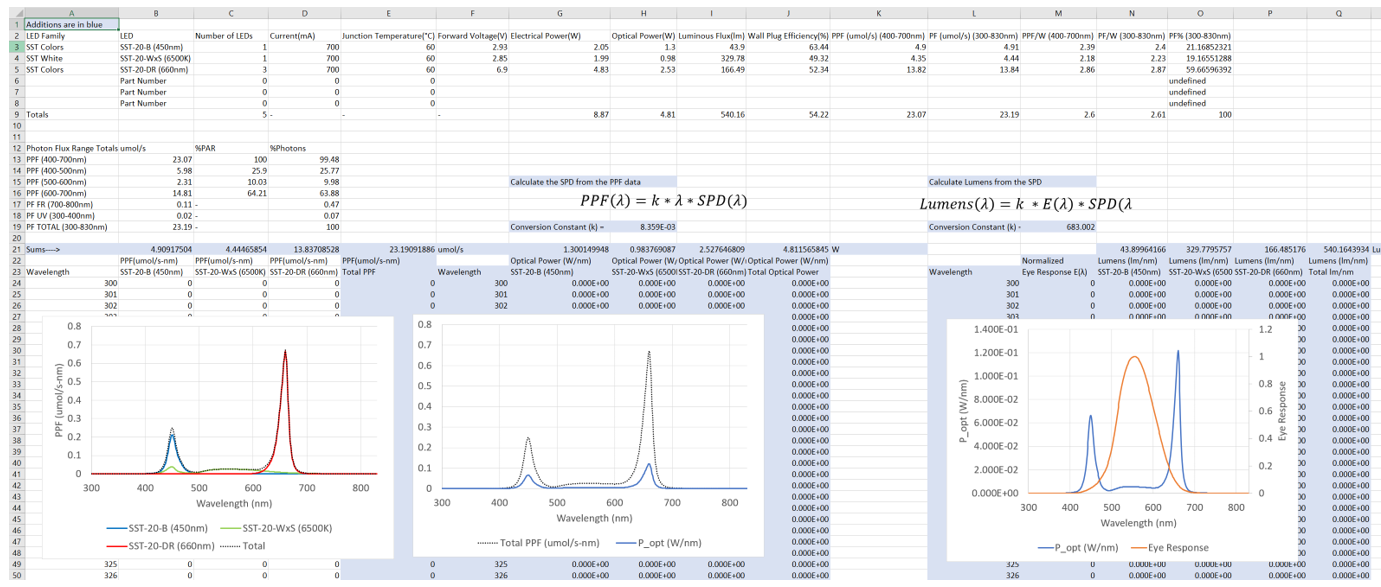
Screenshot of attached Excel calculator with additional calculations highlighted in blue.
The Luminus Horticulture Calculator is a useful tool to choose LED components and drive conditions to meet efficiency and spectral distribution design goals. The unit cell approach is recommended. First decide on the number of LEDs and drive conditions to meet spectral and efficiency goals, then scale up to meet other design goals.
For instance, if a nominally 50 W heatsink is to be used for this solution, we see that the input electrical power is 8.87 W/cell and the 50 W heatsink constraint is bracketed by 5- or 6-unit cells (44.35 and 53.22 W).
The 5-cell solution implies a pure series string or pure parallel configuration while the even numbered
6-cell solution also allows several series parallel solutions. The figure below shows the topology for a 2 series – 3 parallel (2s, 3p) layout of six-unit cells. The power supply for this layout needs to be able to supply 25.36 V and 2.1 A.
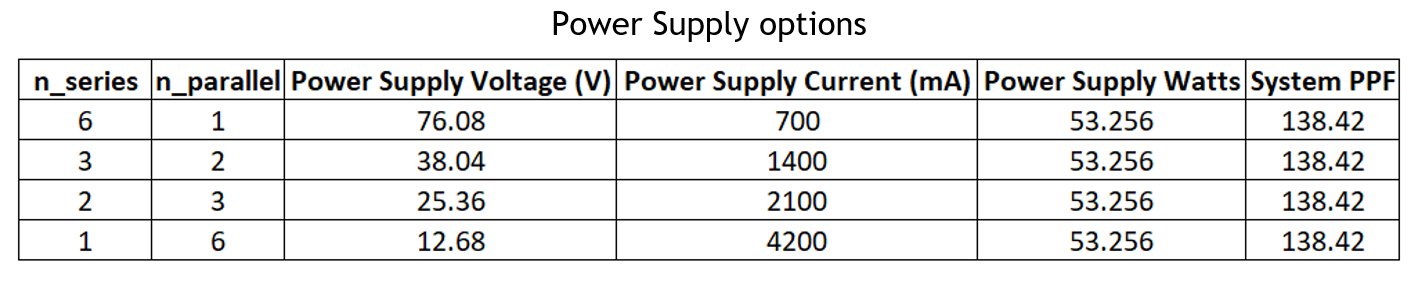
The PPF for the system is 6 * 23.07 = 138.42 μmol/s. The table below summarizes the four possibilities. The actual configuration choice depends on: sourcing an off the shelf power supply, safety certification issues, power supply efficiency at the selected drive condition, and other designer preferences.
Many designers avoid pure series designs due to the single point failure issue where everything in series goes out if one part fails open. Another consideration is the higher string voltages can make it more difficult to get a safety certification.
For these particular calculated numbers, we recommend avoiding the pure series solution because it is over 50 volts and will add cost in safety related design features. All three of the series parallel solutions are viable. We discuss current hogging in a related article and having five LEDs in series for the unit cell of the 1s, 6p configuration below should mitigate any potential current hogging.
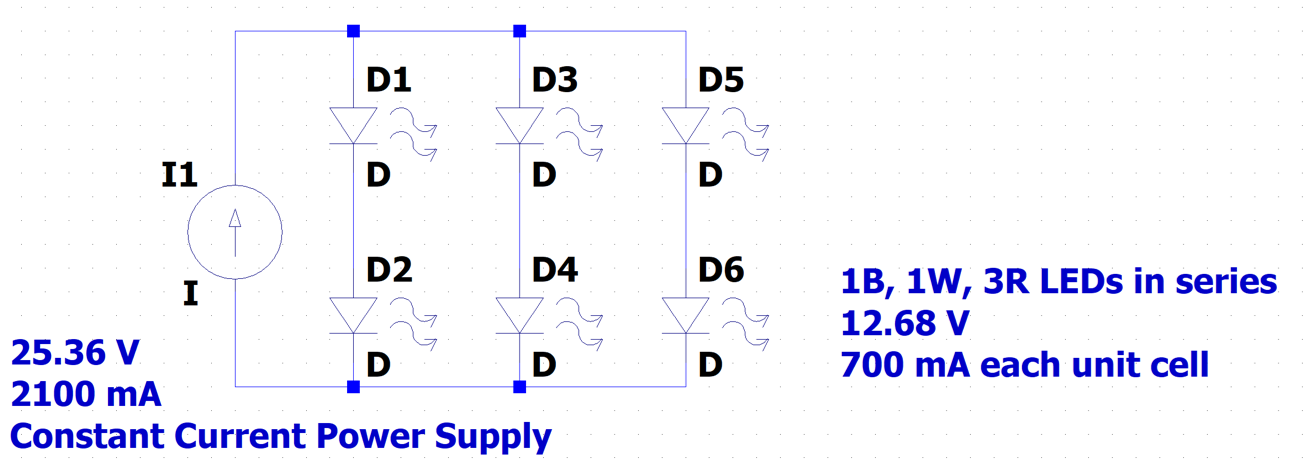
Circuit layout example
There are many potential constraints that can be used in the unit cell approach. Some are:
- Input power/thermal constraints
- System PPF goals
- Cost minimization
- Reliability and lifetime maximization
- DLC rating (efficiency) maximization
- Safety issues.
- Spectral customization to control growth morphology and other effects that can be controlled by spectral tuning.
The Luminus Horticulture Calculator can be employed to run scenarios that can be combined with other analysis to optimize a design goal.
PPFD – Photosynthetic Photon Flux Density
PPFD (μmol/s/m2) is analogous to lux in traditional lighting systems. PPFD is the number of photons per unit area per unit time which is appropriate for analyzing a photon-driven biological process like photosynthesis. Calculation of PPFD patterns requires knowledge of the beam pattern of light sources, the number and arrangement of sources, and the amount of PPF emitted by each source. Horticulture installations tend to be large areas where the light sources interact with each other in complex ways.
This is best analyzed with optical software. There are many choices for software, and we will demonstrate a free application, DIAlux evo. DIAlux evo is a powerful program with a robust help support system and we will mainly show a few things you can do with it rather than a detailed tutorial.
In the PPF section above, we selected LEDs suitable for a 50 W fixture that produces a total of 138 μmol/s with an efficacy of 2.8 μmol/J. We further specify that this is a bar fixture, 1-meter long, and has a perfect Lambertian beam pattern. Lambertian beam patterns are common with horticulture fixtures.
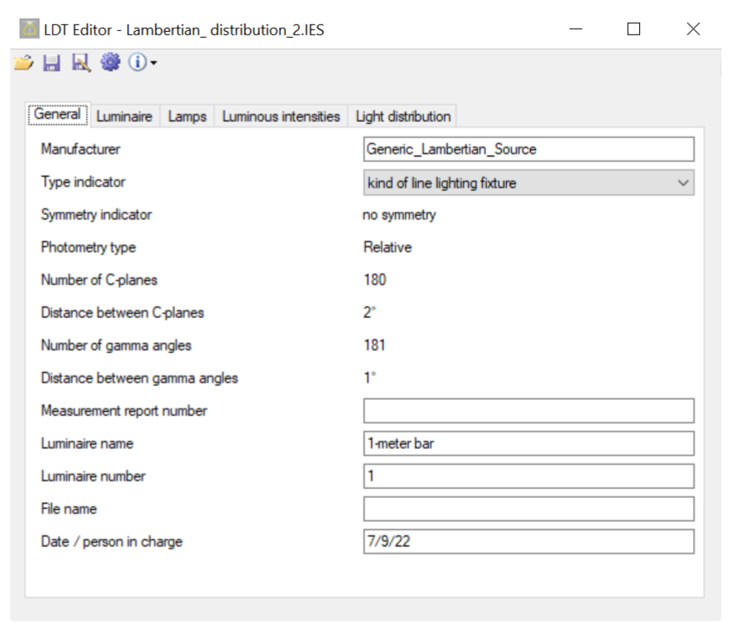
There are two steps to creating this simulation. First, we create a custom EULUMDAT (LDT) file that represents the bar element. Second, we import this LDT file into DIAlux evo and set up an array simulation.
DIAlux provides a useful utility that imports an existing IES or LDT file and allows one to modify the internal structure of the file. To model a bar, we need to set the correct dimensions of the illuminated area and set the “lumens” to the desired PPF value (138 μmol/s). In the figure below, we have opened an existing IES file named Lambertian_distribution_2.ies and selected that we want to modify this file to a “kind of line lighting fixture”.
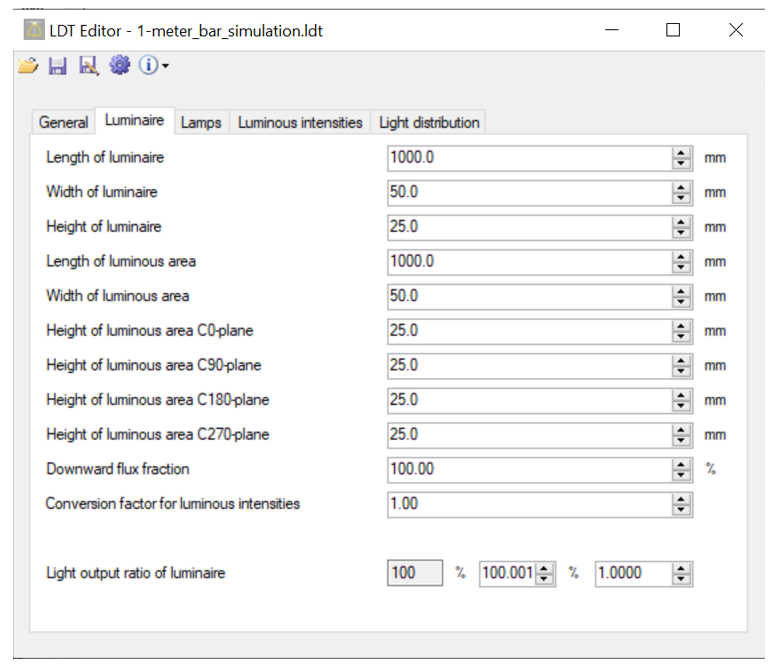
The Luminaire tab allows us to define the geometry of the fixture LES.
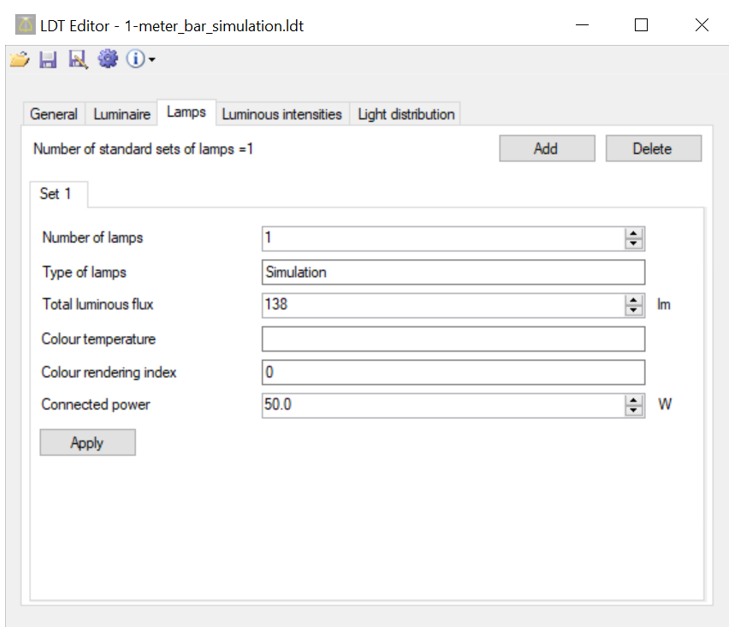
The Lamps tab lets us set the PPF (138 μmol/s) and the input wattage of the fixture (50 W). Click the apply button. The Luminus intensities tab has tabulated data for this luminaire and the Light distribution tab shows the Polar and Cartesian plots for this fixture. Once everything is set, save the file with a new name.
There is an app “IES Viewer V2.99n” that can be used to manage directories of IES files. Here we use it to view the file we just created.
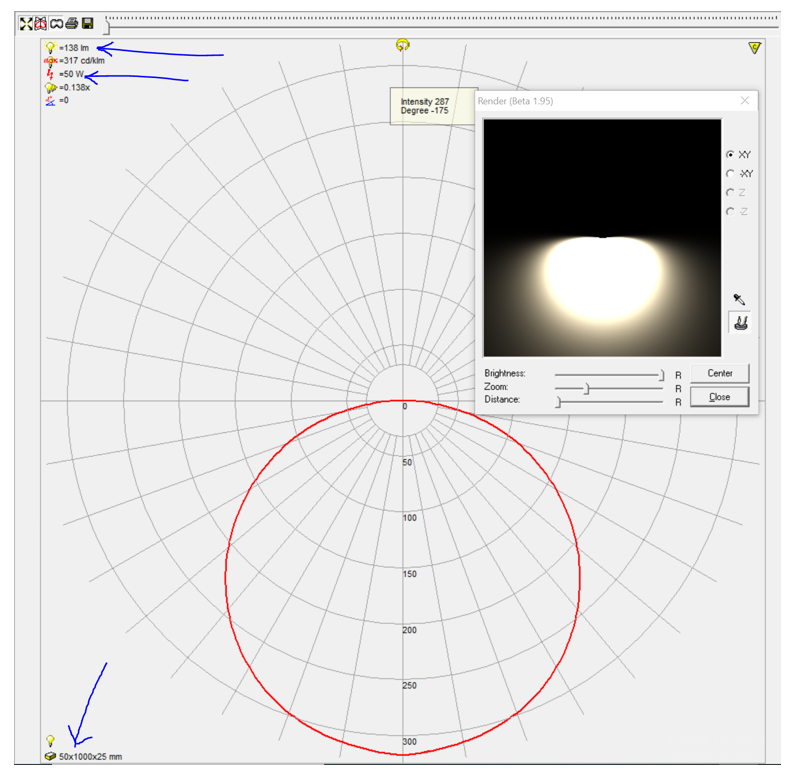
This polar plot is what bare LEDs look like. They closely follow the cosine function in Cartesian plots. LED package optics and shading can change these Lambertian beam patterns but LEDs with 120-degree beam ratings basically all look like this.
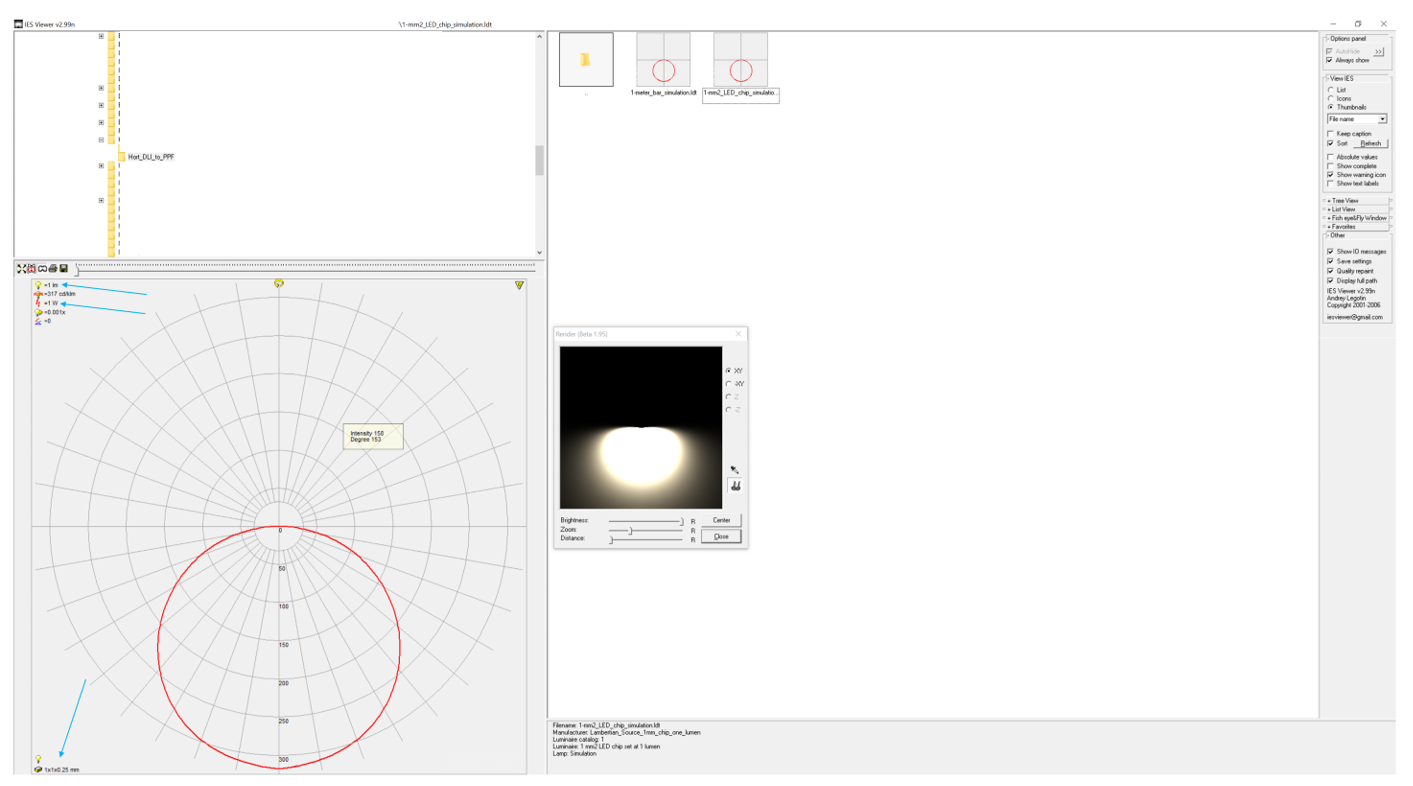
Prototype file for a bare LED simulation. These two files are in the downloads section of this article. Free downloads of other IES and LDT files are easily found with a Google search.
Now we show the click stream to simulate these bars in DIAlux.
Open DIAlux and select Simple indoor planning. This will create a default room to populate with luminaires.
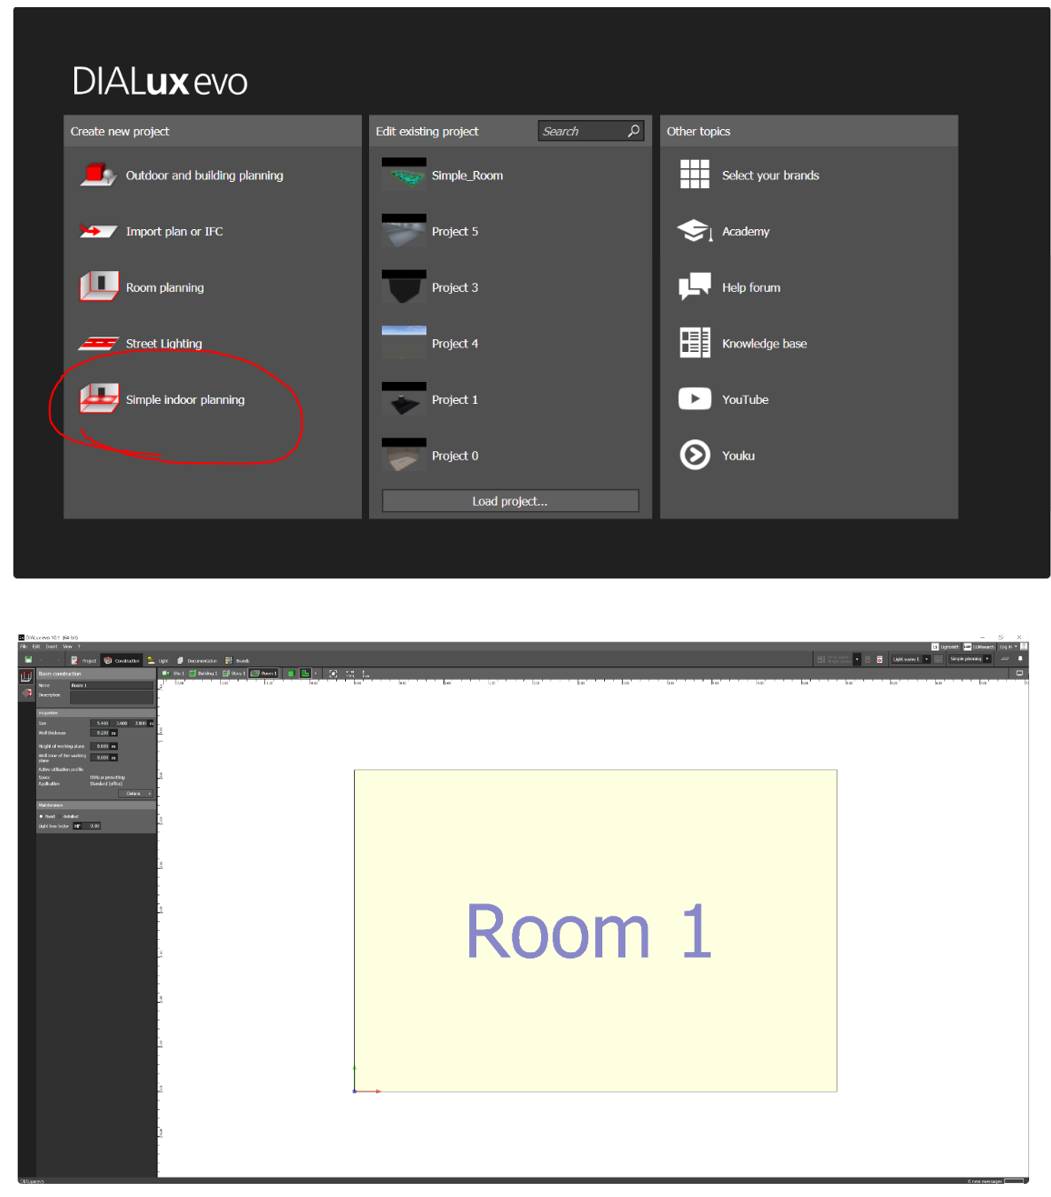
The menu on the left can change the size of the room. The second tab on the left lets you set the reflectivity of the room surfaces.
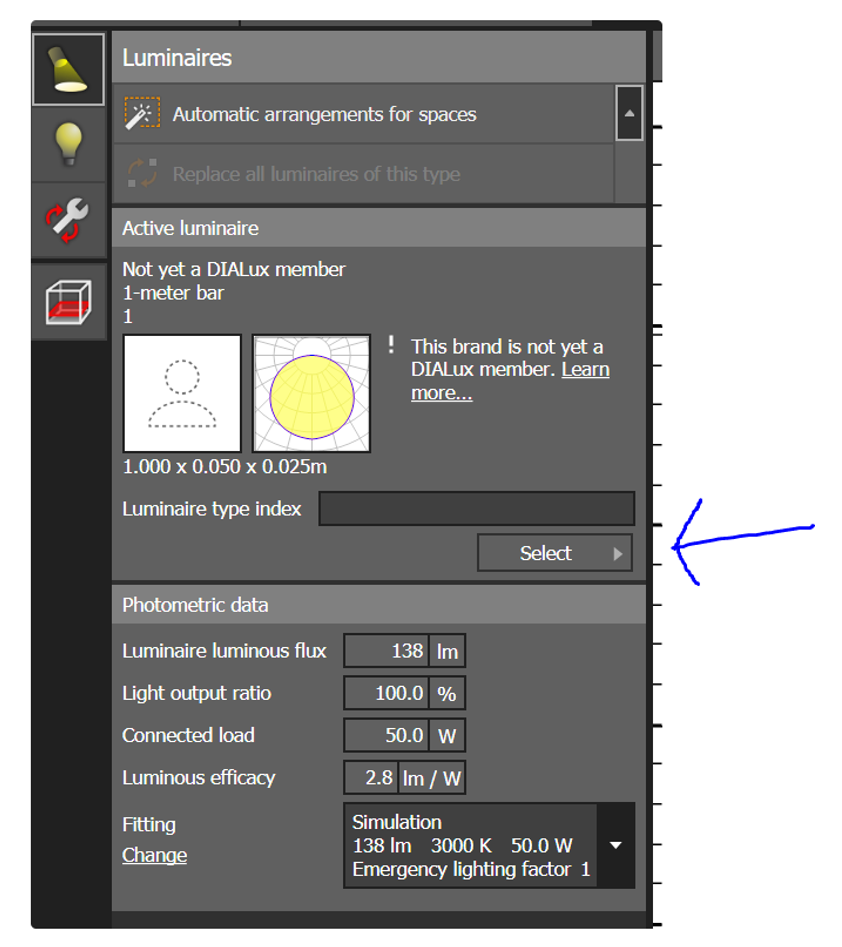
To import the LDT file, click the Luminaires tab and click Select. There is a small icon on the bottom left of the panel that appears called “Import luminaire file”. Click this and select the LDT file for the bar.
If you want to manually place luminaires, you drag them into the room and click on them to get positioning menus.
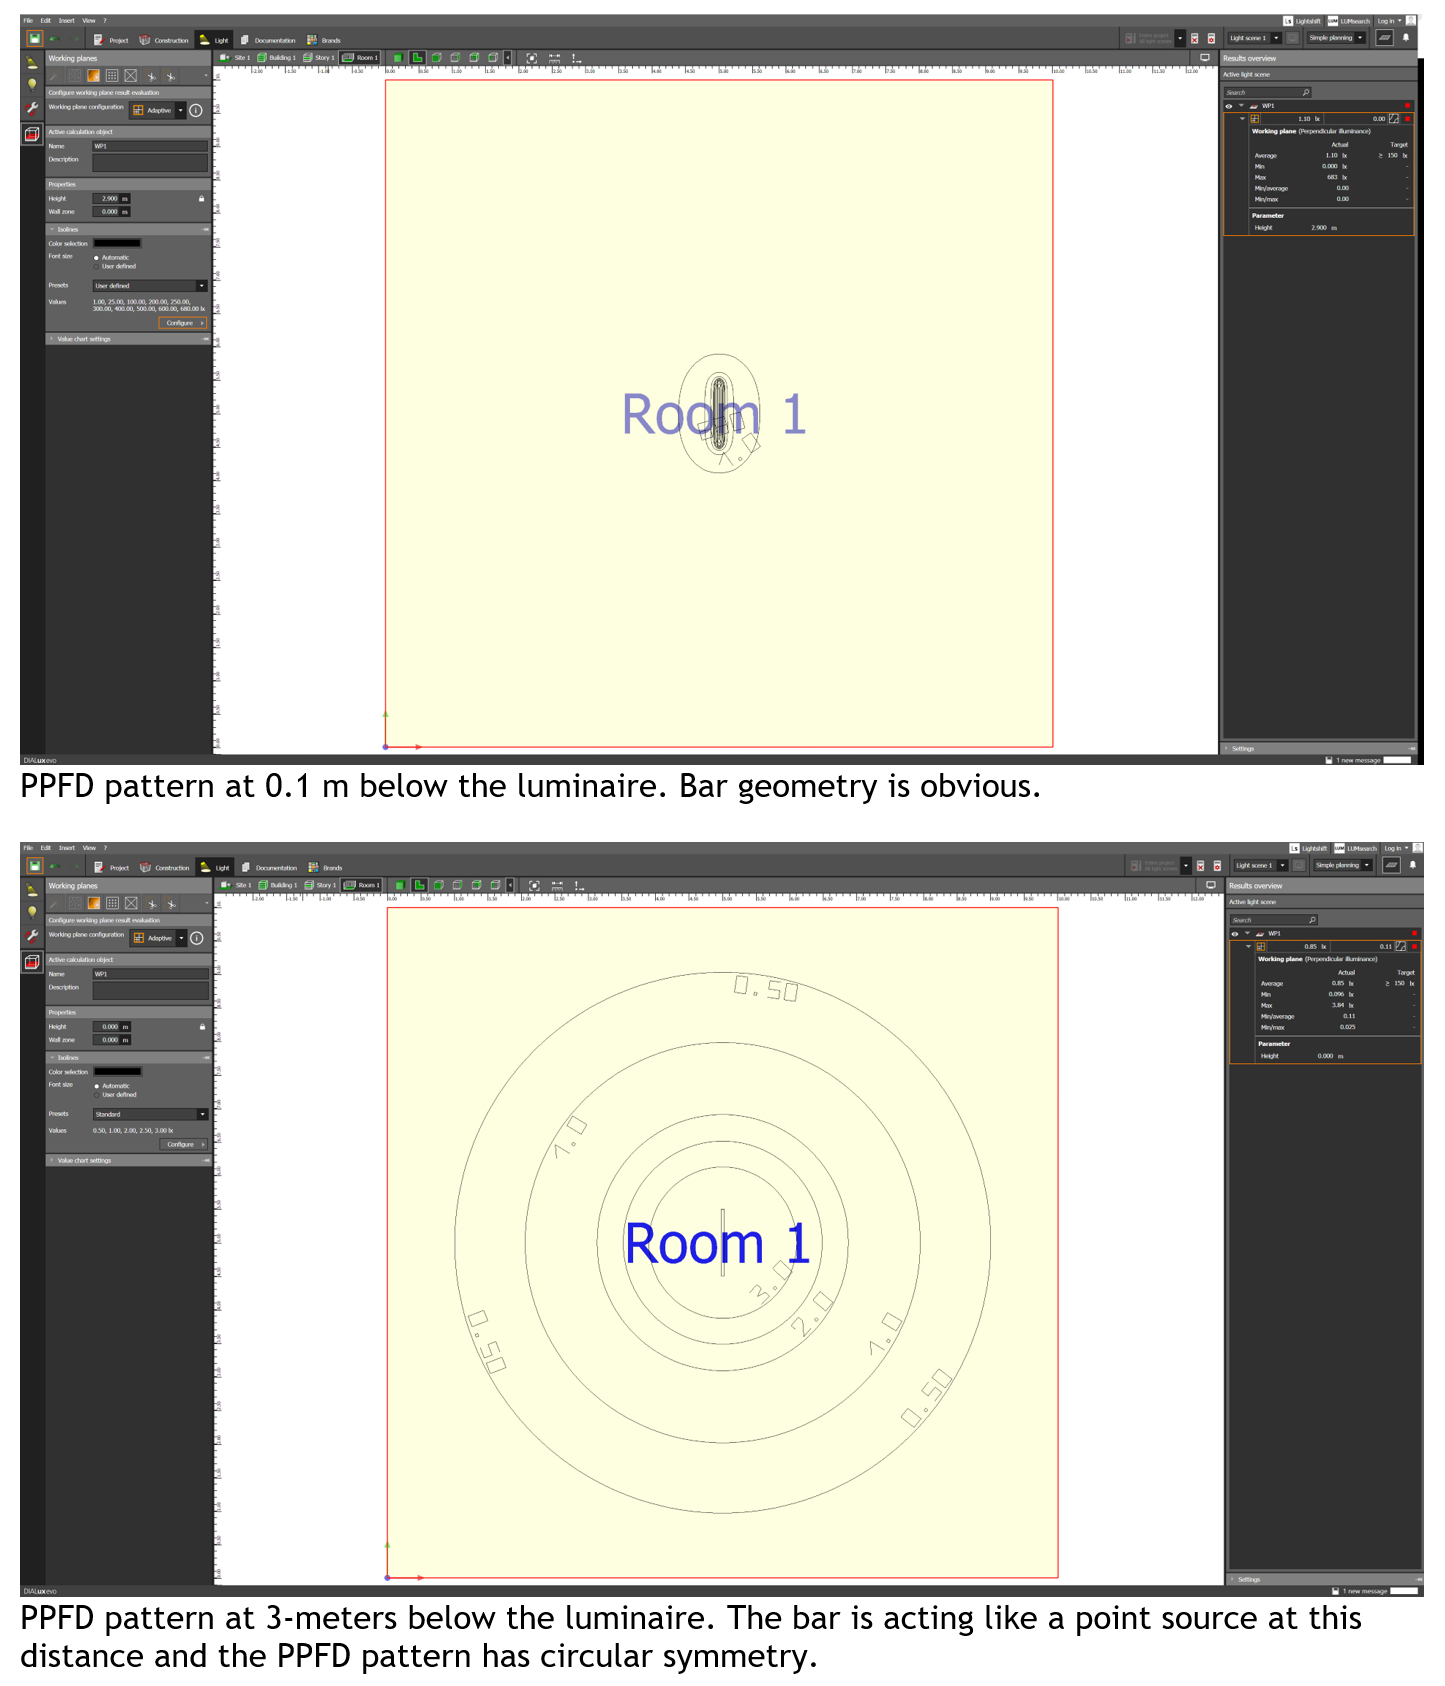
We use this method in the figures below to verify that the luminaire LDT file we created acts like a bar. Moving the plane around and adjusting the isolines gives a lot of information about the luminaire beam pattern.
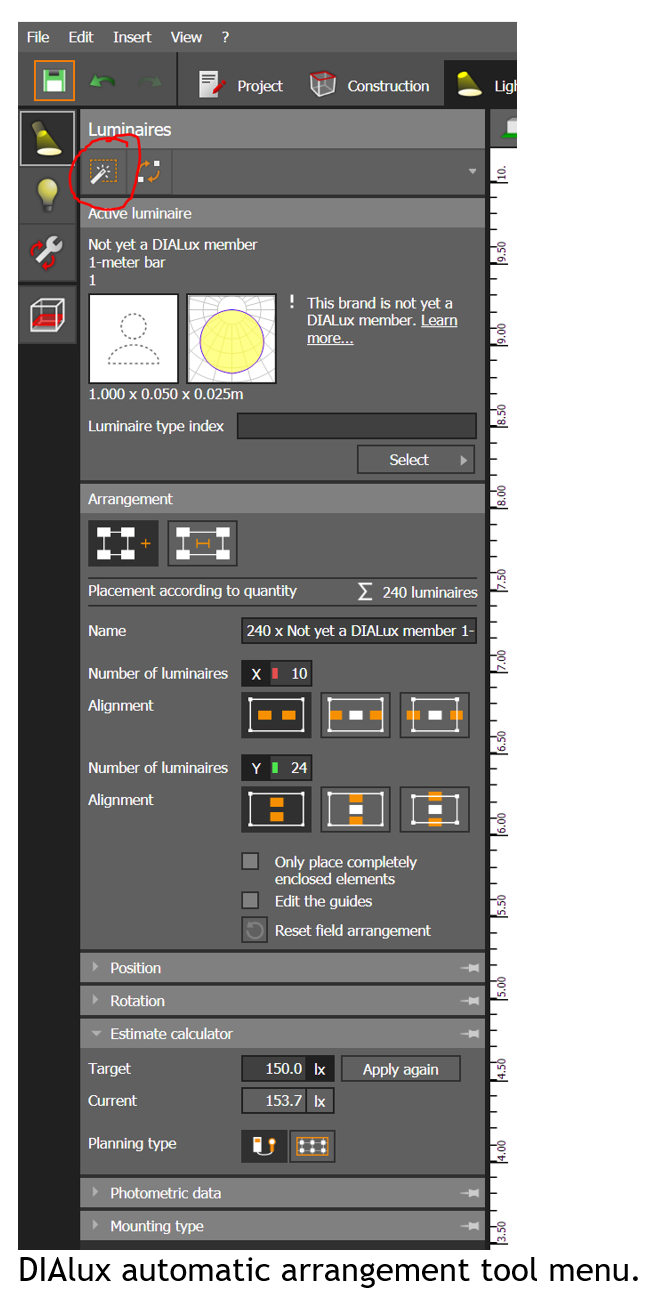
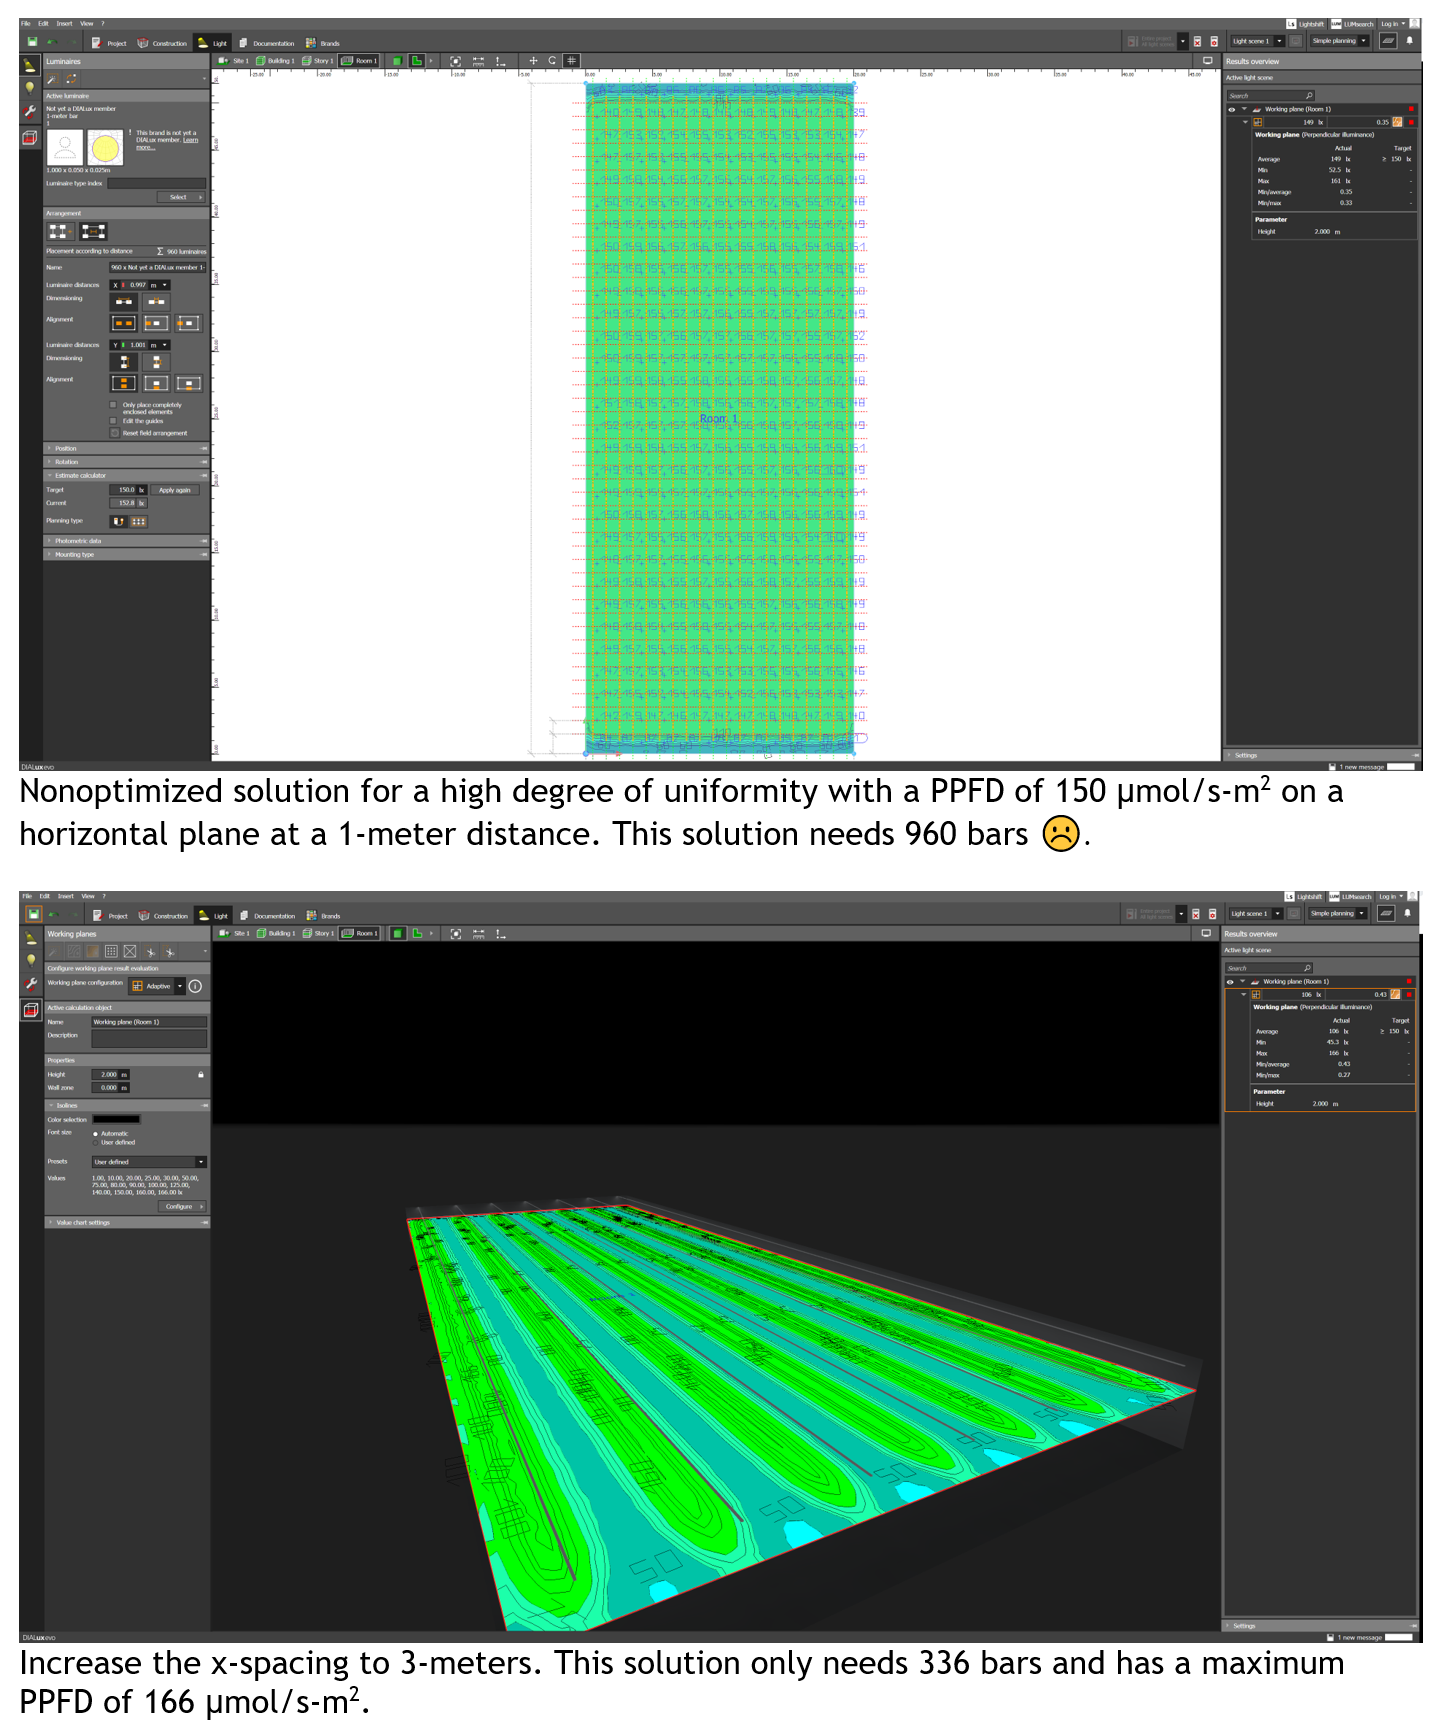
DIAlux has a useful tool for populating rooms with grids of luminaires. This tool has a lot of features which are supported by the DIAlux help system. We will just show some examples of output for a 20 by
50 meter area with a horizontal plane targeted PPFD of 150 μmol/s-m2 at a 1-meter distance from the light sources. Once you have set up a model in DIAlux, it is easy to change the spacing of luminaires and optimize the layout. This is done by clicking on one of the fixtures, so the “Arrangement” menu is enabled, changing the bar spacing, and rerunning the ray trace model.
DIAlux has many more capabilities. We have been using a simplified interface. If you change to the full featured menu system, there are a lot of more complex simulation elements. The videos on the DIAlux website explain usage.
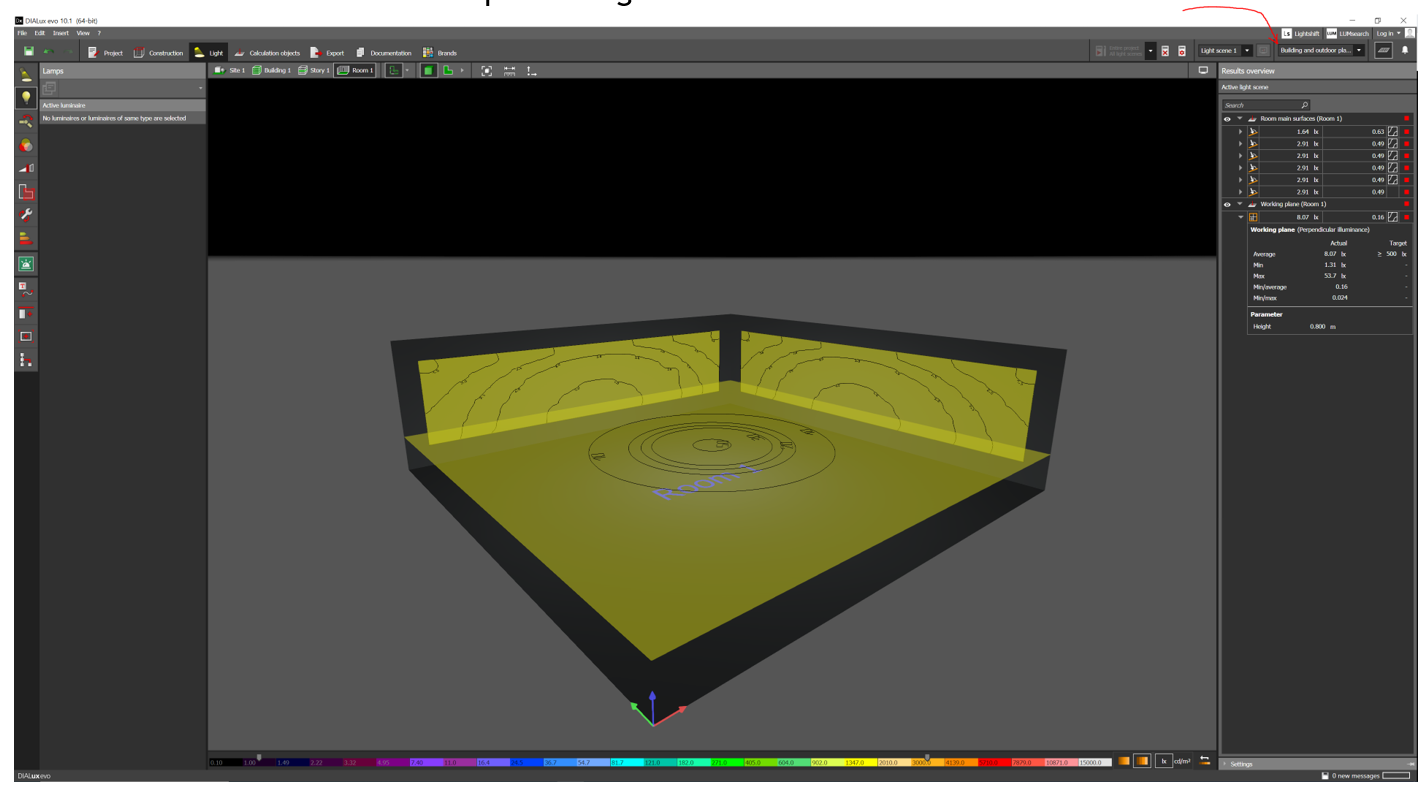
Vertical plane data in DIAlux. The red arrow shows where to change the menu interface from simple to full featured.
Daily Light Integral - DLI
DLI is a knob that the manager of a growth facility turns in combination with other plant growth factors like CO2 level, nutrient levels and composition, and room temperature. Once you have a value for PPFD, the DLI is just the daily photon dose per unit area. The units of DLI are mol/m2-day.
A two-step process is recommended, first convert the PPFD to mol/m2-hour, then calculate the number of hours needed to achieve a desired DLI dose.
Continuing our example, the nominal PPFD from above is 150 μmol/s-m2 and the unit conversion factor (0.0036) gives 0.54 mol/m2-hr. This implies that 150 μmol/s-m2 has a maximum DLI of 12.96 mol/m2-day. Published data for optimum DLI for various types of plants tend to go up to 30 mol/m2-day so we may want to iterate the PPFD design calculation with a higher target.
A DLI of 30 with 20 hours on-time requires a PPFD of about 450 μmol/s-m2. It is an interesting coincidence that the lux level design goals for lighting an office space have similar numbers as optimal PPFD goals for horticulture lighting.
--------------------------------------------------------------------------------------------------------------------
Luminus Website https://www.luminus.com/
Luminus Product Information (datasheets): https://www.luminus.com/products
Luminus Design Support (ray files, calculators, ecosystem items: [power supplies, lenses, heatsinks]): https://www.luminus.com/resources
Luminus Product Information sorted by Applications: https://www.luminus.com/applications
Where to buy Samples of Luminus LEDs: https://www.luminus.com/contact/wheretobuy.
Comments
0 comments
Please sign in to leave a comment.