
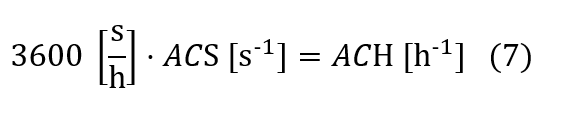
Air changes per hour (ACH) is a metric used in the analysis of building ventilation. At the most basic level, it is the air change rate per hour for a control volume. American HVAC systems commonly uses cfm units. So

in this unit system where
- ACH is the number of air changes per hour (h-1)
- Q is the flow of air in cubic feet per minute (cfm)
- V is the volume of the space under consideration in cubic feet (ft3) [as long as the length units match, any unit system can be used – if the time units are different, adjust the constant].
The relationship between ACH and UV disinfection comes from the use of equivalent-ACH (eACH) to describe the removal/inactivation of biologicals and contaminants by any process in a ventilation system. The “e” is commonly omitted and descriptive terms like ACHfilter, ACHUVG, etc. are used instead of eACHsubscript. Equivalent air changes per hour is modeled as a first order decay process where
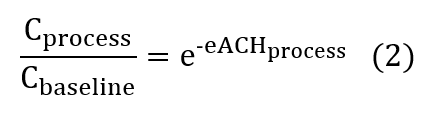
so

and the time (minutes) needed to remove/inactivate contaminants is

where Dxx denotes the desired removal (D90 = 90% removal --> CD90 = 0.1,
D99 = 99% removal --> CD99 = 0.01, etc. and Cbaseline is generally = 1.0). The table below shows some numeric values for these relations.

Table* adapted from “Guidelines for Environmental Infection Control in Health-Care Facilities (2003)”.
* “Values apply to an empty room with no aerosol-generating source. With a person present and generating aerosol, this table would not apply. Other equations are available that include a constant generating source. "
We will now extend these concepts to ultraviolet (UV) disinfection. Ultraviolet disinfection is often referred to as UVG and UVGI where the “G” means germicidal. There is a push to use UVG and omit the “I” which means irradiation and can be conflated with unrelated radioactive hazards.
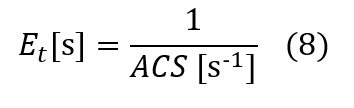
The Sheet Metal and Air Conditioning Contractors’ National Association (SMACNA) discusses ultraviolet germicidal (UVG) concepts in detail and provides a method of calculating the germicidal removal rate for a given air flow and UV intensity. Their derivation is as follows
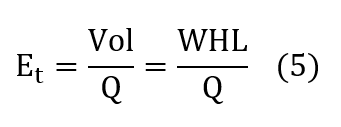
- Et is exposure time (sec) which is the reciprocal of the air changes per second (ACS)
- Vol is volume (m3)
- Q is airflow (m3/s)
- W, H, L are width, height, length (m) of the defined volume
The UVG removal rate is then

- RRUVG is the removal rate for the UVG process (1-survival fraction)
- k is the UV rate constant for the organism under consideration (m2/J).
- Im is the mean irradiance (W/m2) [ 1μW/cm2 = 0.01 W/m2 ]
since
and
we can write the survival fraction in terms of ACH as
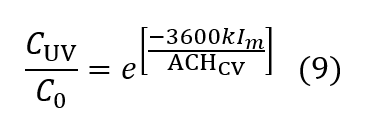
and then use equation 3 to calculate the eACHUV value. We have added a subscript ACHCV to remind us that this ACH applies to the control volume being irradiated by UVC. This analysis uses average values for irradiance and assumes uniform air flow. More complex models will need to integrate the interaction between these two fields.
The following table is used to validate these equations and illustrate usage.
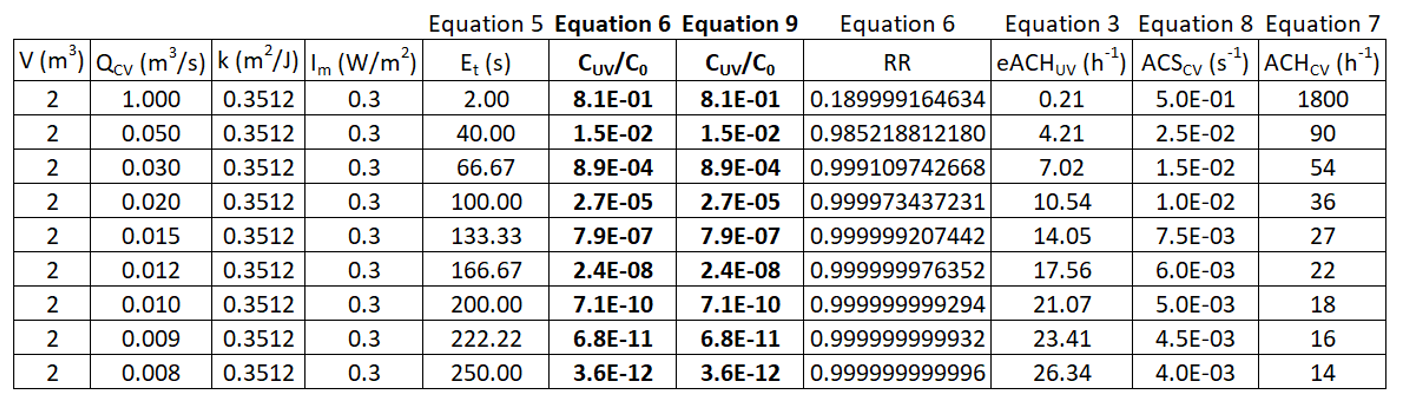
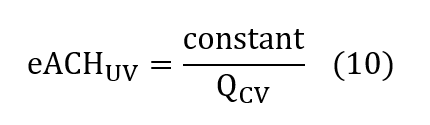
An interesting result of these calculations is that the plot of eACHUV vs. Qcv has a perfect fit to the following reciprocal function.
We note that for an analysis of the UVG control volume in isolation, slower airflow is better since there is a longer dwell time in the UVG zone. In real applications where aerosolized virus generation sources and other eACH cleansing components are combined there will be a different “best” solution that considers all system elements. Disinfecting air in the UVG control volume has little value if it does not move back into the breathing space.
As an example of a more complex model, Bouri and Shatalov have published an online calculator that uses similar concepts to relate UVC levels with eACHUV including optical elements like Hg tube geometry and cylinder wall reflections. The accompanying publication has data and an estimation method for the UV rate constant, k, for a number of coronaviruses as well as reflectivity values for various materials.
Literature
In this section we will cite a number of studies where the ACH approach has value.
- We will cite recommended ACH levels and introduce infection risk models.
- We will link sources where you can find the eACH equations for other processes such as filtering recirculated air but in the interests of brevity we will not discuss them in detail here.
- We will briefly present some case studies and then focus on the promise of adding UV sterilization to building design and retrofit. Upper air UVG sterilization has significant value in increasing the net ACH of existing buildings by inactivating small, aerosolized virus-loaded droplets with a lower retrofit cost than other options.
The equivalent eACH concept is used extensively in evaluating building ventilation strategies as part of specifying safe ventilation levels for different scenarios. The CDC reference above has extensive tables of recommended ACH levels for hospital areas. ASHRAE Standard 62, “Ventilation for Acceptable Indoor Air Quality, and ASHRAE Handbook – HVAC Applications” has guidance for a wider variety of what they call breathing zones.
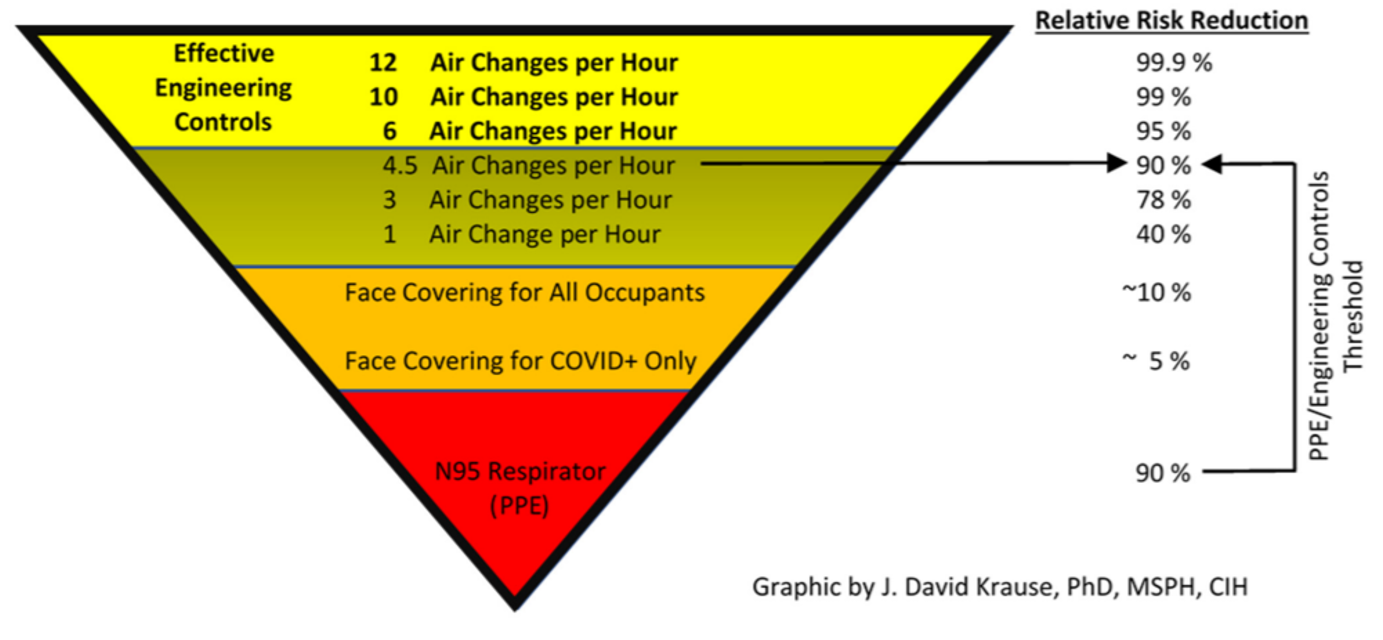
The American Industrial Hygiene Association (AIHA) recommend the use of engineering controls in all indoor workplaces, even those outside of the healthcare industry, to reduce the spread of COVID-19. The figure below shows that increasing ACH is highly recommended to reduce transmission risks.
The figure below from Wang et al illustrates elements that can be characterized by ACH as a parameter in analyzing building ventilation. This article has extensive discussion on modeling the effective range of droplets based on size and other characteristics. This study has a focus on mechanisms of airborne transmission of viruses and resulting risk of infection using the Wells-Riley infection model.
This type of study is of great interest during the pandemic since virus-laden aerosol factors have been acknowledged by WHO and the CDC as being a significant factor in transmission of SARS-CoV-2.
Pre-pandemic, the recommended ACH levels for buildings were based on odor and temperature control versus energy consumption and installation costs. The recommended levels for homes were about 1 ACH, schools 2-3 ACH, and hospitals 6-12 ACH. The consensus was that the risks of aerosolized transmission were low, and these ACH levels were adequate to maintain healthy buildings. It is not clear to what extent these recommendations will be modified in the future.
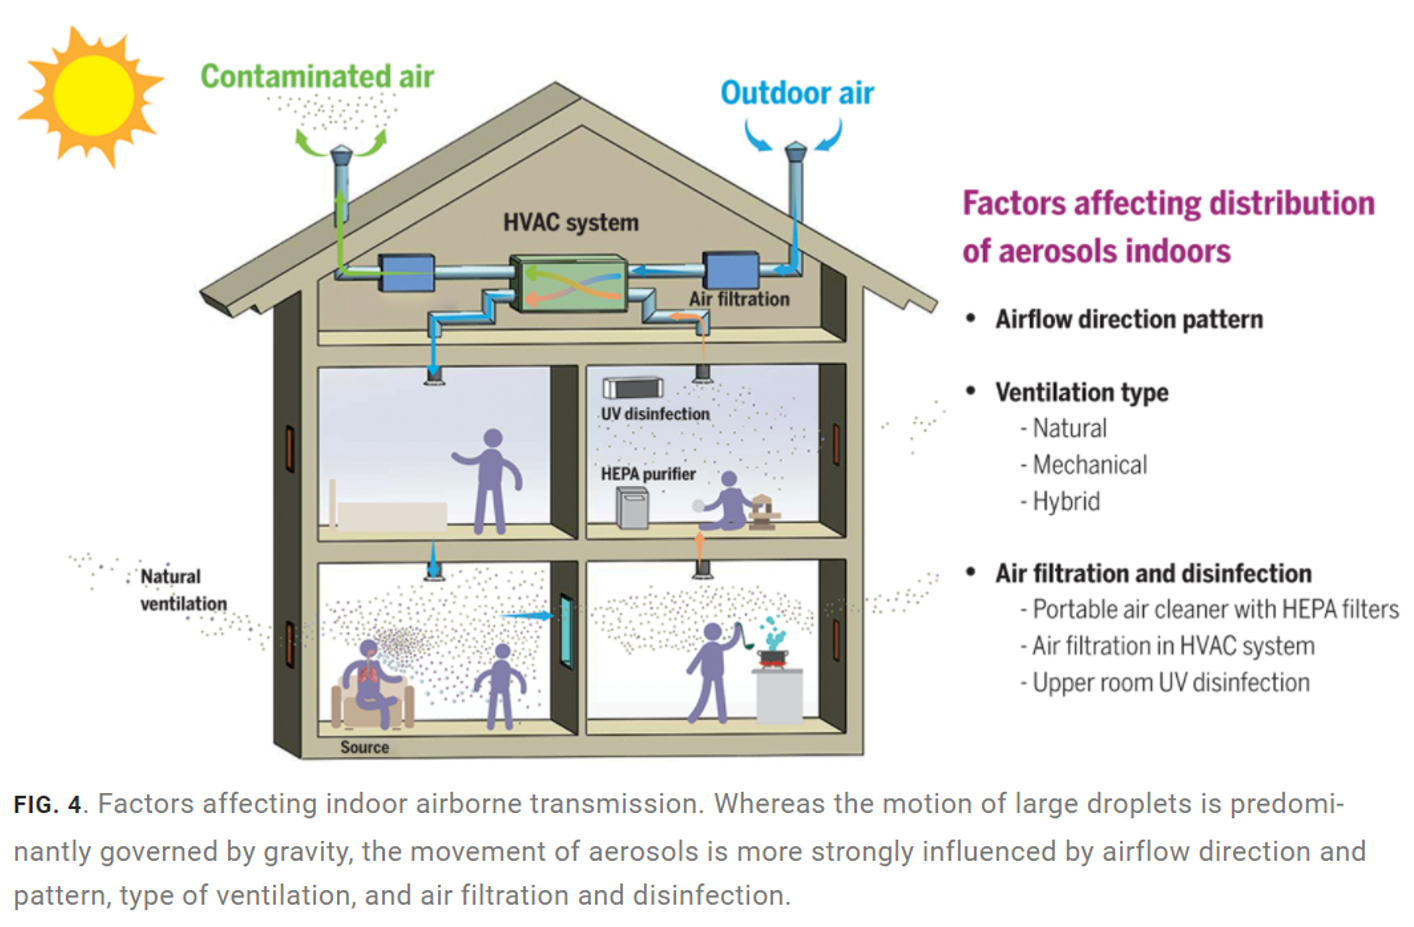
In the figure, an infected person is in the lower left room and a schematic of the airflow with different mitigation methods is displayed. The infection probability is highest in proximity to the source and is reduced as the equivalent ACH dilution effects (natural ventilation, forced ventilation, local purifiers, UV purifiers) come into play.
A similar droplet model is found in Bazant and Bush where there is a focus on mask effectiveness as a function of speaking modes. Bazant and Bush provide a related online calculator that estimates the safe time and occupancy for different types of rooms and behaviors. The World Health Organization presents guidance in Natural Ventilation for Infection Control in Health-Care Settings which also discusses droplet-ventilation models.
Hayashi et al. analyzes numerous infection case studies and correlates known information about Covid-19 clusters. This is a comprehensive article with the following interesting assertion: “The stability of SARS-CoV-2 was comparable to that of SARS-CoV in the experimental environment. As an aerosol with a particle size of less than 5 μm, its survival time was observed to be about 3 hours (Halving time: about 1 hour), and in its state of adhesion to surfaces, its survival time was determined at about 1-3 or 4 days, depending on the material it adhered to.” Azuma et al. presents extensive tables of persistence of coronaviruses in aerosols at different temperatures and relative humidity.
Cotman et al. provides analysis of different building ventilation scenarios using ACH, recirculation filtering effects (Minimum Efficiency Reporting Values - MERV), and fraction of outside air (FOA) as parameters in a model which uses a network of well-mixed zones and bi-directional mixing of air between zones. They find that ACH has a strong effect on the infection probability.
“Overall, we found that increasing the ACH was the most impactful mitigation measure across all scenarios and the only one to show meaningful efficacy at low aerosol emission rates (<1,000 PFU / min). Increasing the FOA or filter MERV rating also reduced infections, but primarily at higher emission rates. UVC and in-room filters appear effective in our model. Our results found very little evidence that HVAC systems facilitate SARS-CoV-2 spread, and most infections occurred in individuals who spent time in the simulated release zone.” The findings discussion in Cotman et al. has more detail but is too long to quote directly.
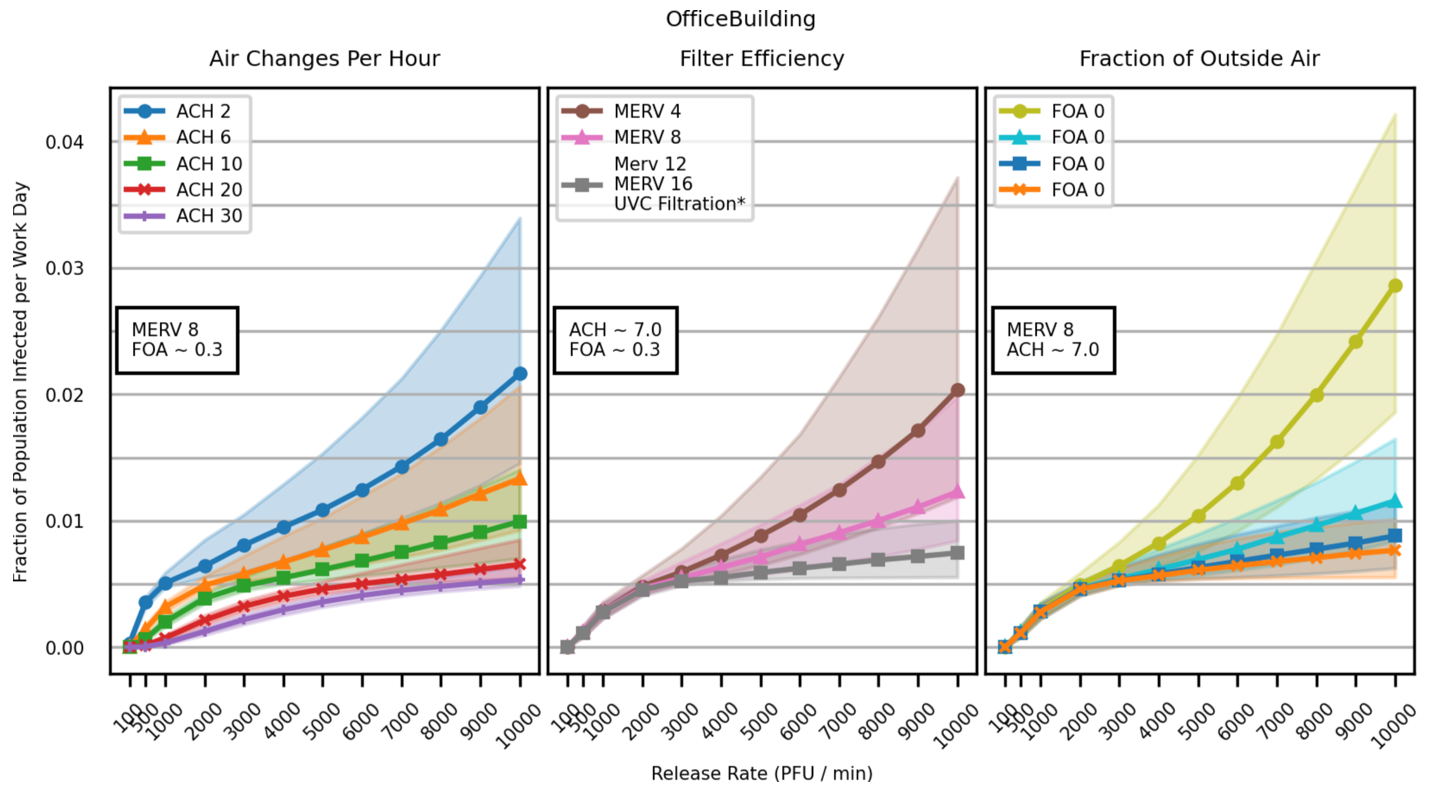
Cotman et al transmission probability model result for an office building using ACH as a parameter. Note that ACH in this figure is actual ACH (equation 1) and that MERV and FOA can be expressed as eACH values using established techniques. This study explores individual effects of ACH, MERV, and FOA but a different study might combine them into one plot.
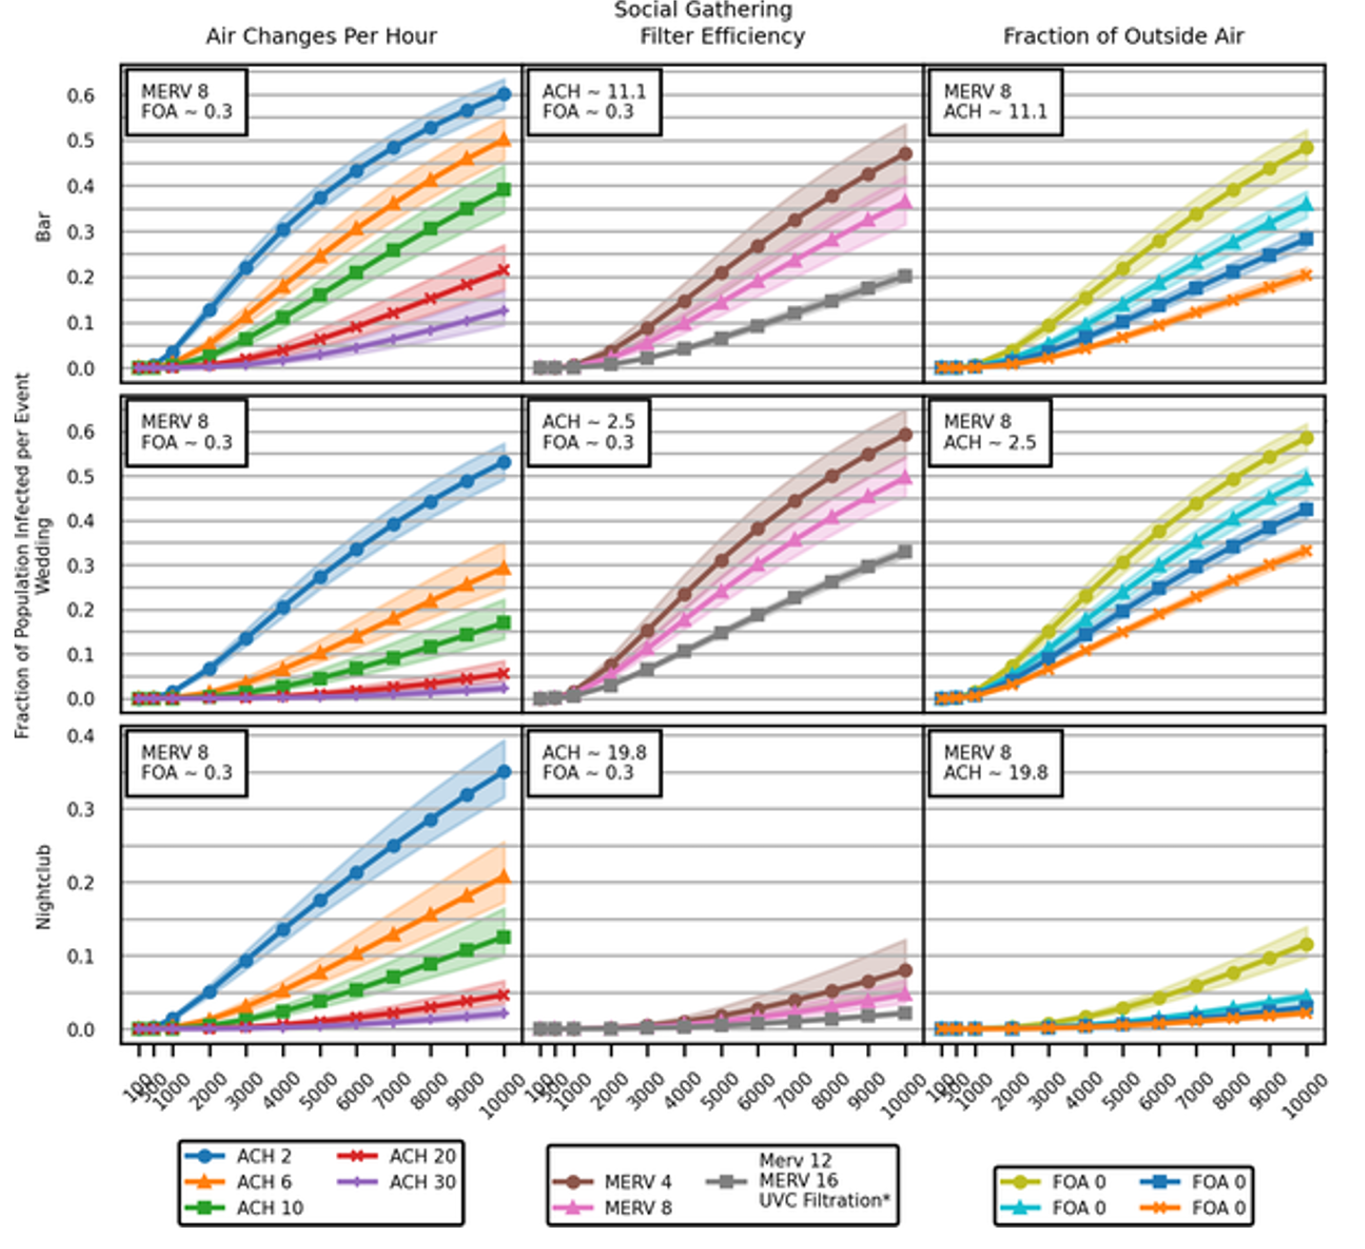
Cotman et al transmission probability model result for social events using ACH as a parameter. Note that these models have much higher transmission probabilities than the office model.
The Rhode Island Department of Health provides a summary of basic strategies to improve ACH and provides a calculator that can be used to estimate ACH using CO2 detectors. There are a number of fact sheets published addressing public concerns about building air quality during the pandemic. An example is “Indoor Air Quality at Jeffco Public Schools” which has some interesting comments about practical and feasible solutions. This ASHRAE article provides summaries of pretty much all of the air disinfection options. The Maryland Department of Health presents another summary.
UVG and eACHUV
The Sheet Metal and Air Conditioning Contractors’ National Association (SMACNA) has considerable practical detail for UVG installations. They provide guidance for average UVC irradiance in duct vs. upper air applications, tabulate UV-reflectivity of various materials, and rank the susceptibility of different organisms to UVG ranging from fungus (least) to virus (most).
The 2019 ASHRAE Handbook—HVAC Applications also has extensive guidance on UVG installations. An important factoid is on page 62.12, “UV-absorbing paints containing titanium oxide can be used on ceilings and walls to minimize reflectance in the occupied space“.
Separately, ASHRAE provides a calculator for UVC sterilization inside an HVAC duct system using the first pass UV sterilization percentage as a parameter. ASHRAE has also published “Environmental Health Committee (EHC) Emerging Issue Brief: Pandemic COVID-19 and Airborne Transmission”.
DHHS (NIOSH) Publication Number 2009-105 presents a recent wrap-up of UVG Tuberculosis (TB) guidelines. TB is a hardier organism than most viruses and TB UVG mitigation studies started in the 1940s. These early UVG installations to control TB transmission were highly effective but the widespread availability of antibiotics post-WW2 led to a deemphasis of the UVG approach. Another recent TB study by Mphaphlele et al. found “Upper room germicidal UV air disinfection with air mixing was highly effective in reducing tuberculosis transmission under hospital conditions.”
The upper air irradiance recommendations (30 µW/cm2 to 50 µW/cm2 ) in much of the literature are based on TB studies and are believed to be higher than the levels needed for virus inactivation.
McDevitt et al. present a careful experimental study of the effectiveness of UV upper room aerosolized virus inactivation. They consider the effects of body heat convection, mechanical mixing (fans), temperature and relative humidity (RH) in a room. “These data show that in a ‘real world’ test setup, upper-room UVC is highly effective for reducing the concentration of vaccinia virus aerosols.”. They measure equivalent ventilation achieved by UVC ranging from a low of 18 to 1000 ACHUVC, with winter equivalent ventilation rates consistently near 100 ACHUVC for their experimental configuration.
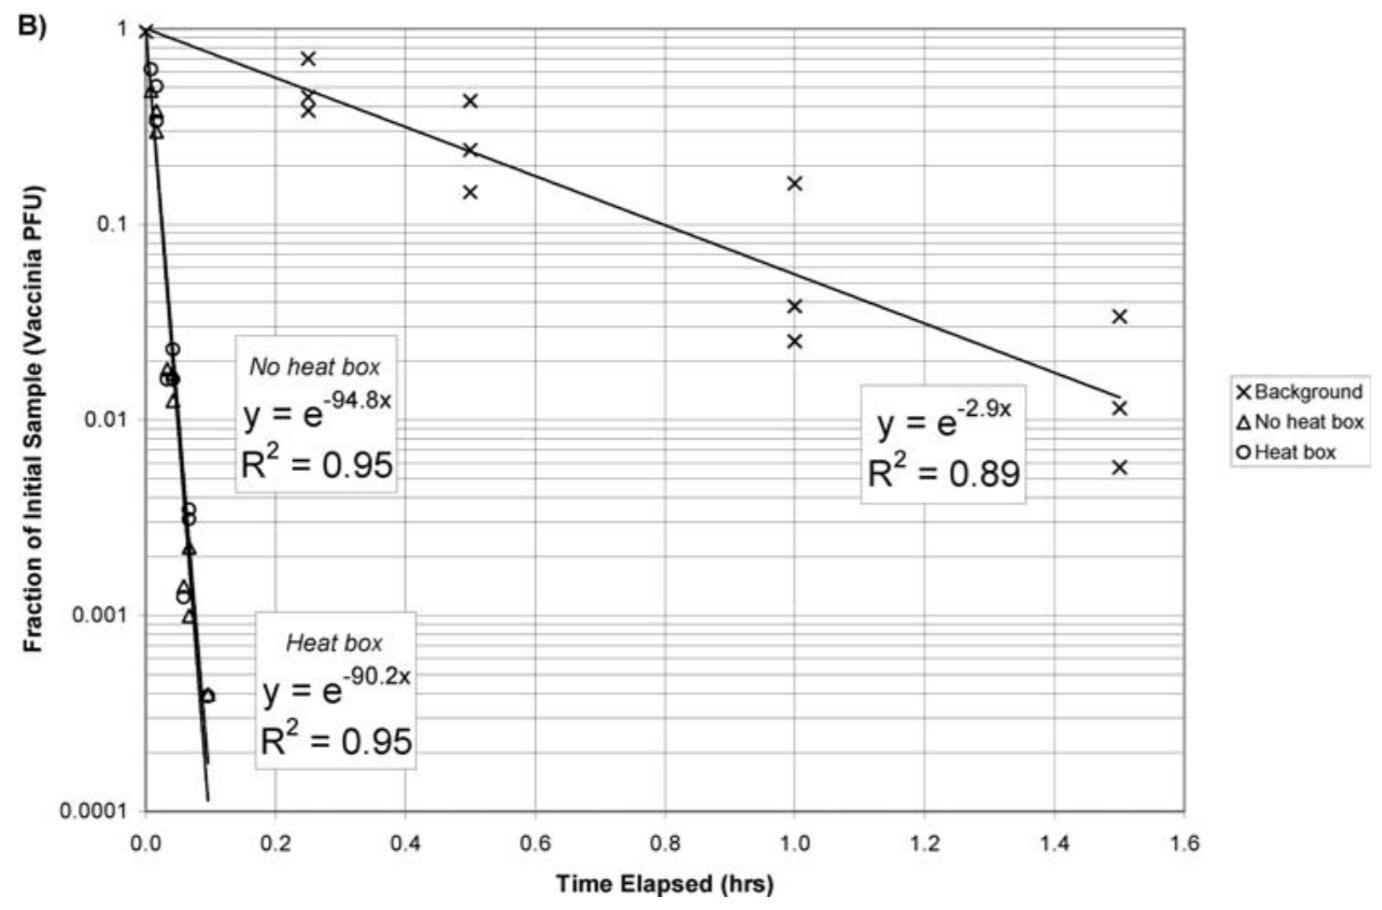
Figure 1-B from McDevitt et al. showing the experimental effectiveness of UVG on a virus using a fan to enhance air circulation. “The rate constant shown in these equations can be interpreted as the effective air exchange rate for the chamber expressed in units of air changes per hour (ACH).” The heat box simulates the natural body heat convection of two people in the room. Figure A (not shown) has data for the experiment with the fan turned off – with and without body heat simulation.
Cost Analysis
The National Institute of Health (NIH) discusses HVAC filtration and a modified Wells-Riley equation to estimate viral inactivation effectiveness for a number of organisms and calculates the costs of upgrading ACH by adding more outside air versus upgrading recirculation filters.
Toronto Public Health has a cost analysis comparing options to increase effective ACH including UVG.
Nardell presents cost comparisons between UVG, ventilation, different types of filters, and finds that UVG is more than nine times more cost effective than increasing ventilation. “Germicidal UV, primarily upper room UV, has for over 80 years provided a safe and highly effective way to disinfect air in occupied rooms where person to person transmission is likely to occur. Quantitatively, where applicable, no other technology approaches the equivalent air changes per hour that can be produced by upper room UV, silently, safely and cost-effectively.”
Related Article - https://luminusdevices.zendesk.com/hc/en-us/articles/4424785185421-What-is-the-Z-Value-and-how-does-it-relate-to-UV-Disinfection-
-----------------------------------------------------------------------------------------------------------------
These links and data are being provided as a convenience and for informational purposes only; they do not constitute an endorsement or an approval by Luminus of any of the products, services or opinions of the corporation or organization or individual. Luminus bears no responsibility for the accuracy, legality or content of the external site or for that of subsequent links. Contact the external site for answers to questions regarding its content.
------------------------------------------------------------------------------------------------------------------
Luminus Website https://www.luminus.com/
Luminus Product Information (datasheets): https://www.luminus.com/products
Luminus Design Support (ray files, calculators, ecosystem items: [power supplies, lenses, heatsinks]): https://www.luminus.com/resources
Luminus Product Information sorted by Applications: https://www.luminus.com/applications
Where to buy Samples of Luminus LEDs: https://www.luminus.com/contact/wheretobuy.
--------------------------------------------------------------------------------------------------------------------
Technical Support Contact Information: techsupport@luminus.com
Sales Support Contact Information: sales@luminus.com
Customer Service Support Contact Information: cs@luminus.com
Comments
0 comments
Please sign in to leave a comment.