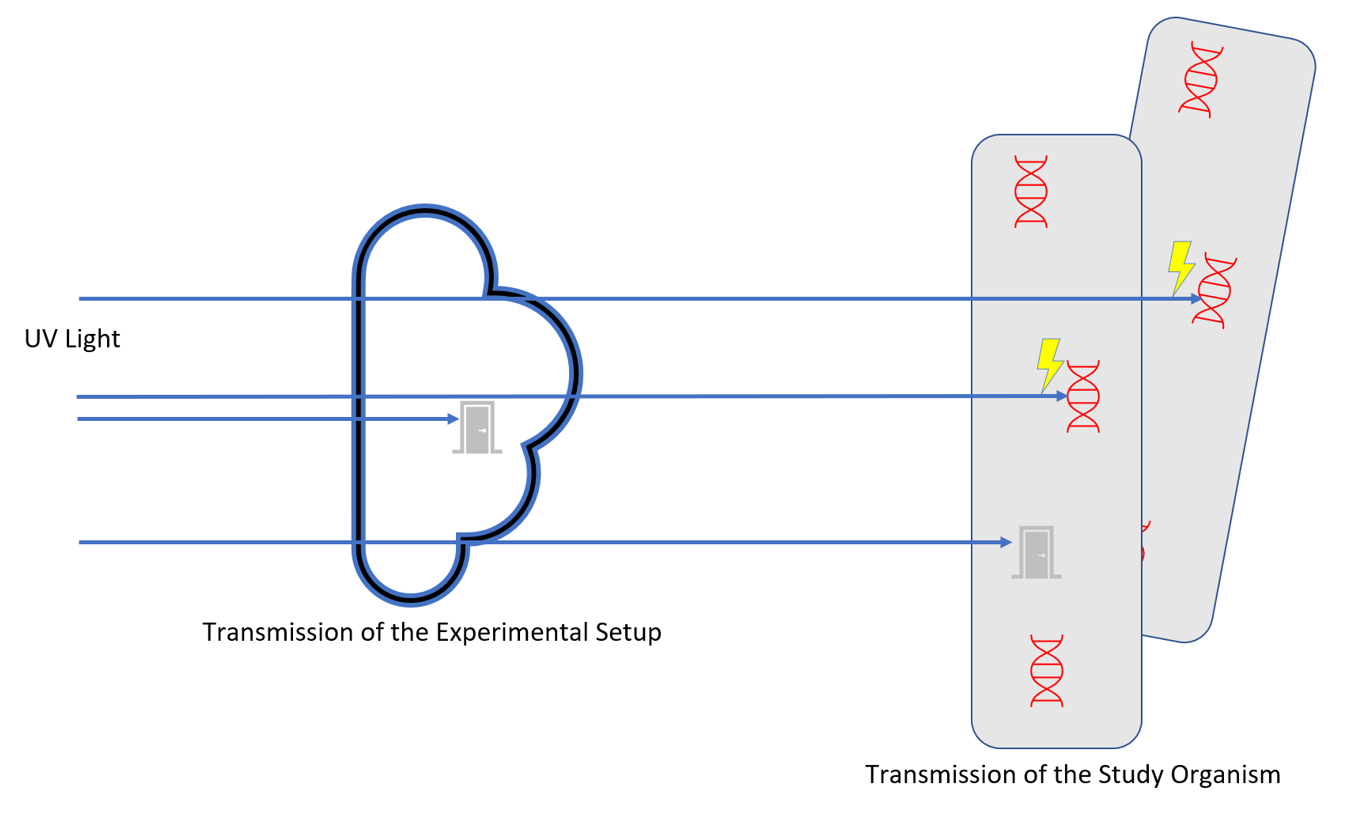
The Z-value (susceptibility parameter) is a comparative value that can be used to compare UV disinfection effectiveness for different experimental and parametric studies. The Z-value is calculated by fitting survival fraction vs. dose (fluence) data to a first order decay model and requiring that the intercept equals one.

Using the Z-Value method requires the assumption that the organism under consideration follows a first order decay equation. This is true for many, but not all, of the data found in the literature.
The figure below, digitized from Fig 1 in McDevitt, Rudnick, and Radonovich, shows data for UV sterilization of airborne influenza virus particles using different levels of relative humidity. We can use ratios of Z-values to state that, for the same UV dose, inactivation for 75% RH is only 76% as effective as 25% RH conditions.


By inspection, we can conclude a first order Z-model model is useful for the range of data shown in this figure.
Since we have a constraint in the definition of Z that the intercept = 1, we can calculate a Z=value for a single data point if the fluence (mW/cm2) and the survival fraction are known. If we have more data, we can calculate a better fit for Z and evaluate if the assumption of a first order decay model is appropriate.
solve equation (1) for Z

so for an nlog10 dose where n can be any real number as long as the first-order decay process assumption is valid

Note that this method has the same results as multiplying a given 1log10 (D90) dose by n to calculate a new dose required for nlog10 disinfection.
The Luminus App Note “UV-C LEDs for Disinfection and Sterilization” has the following data table of 1log10 fluence for various organisms. We can calculate Z from the 1log10 fluence and compare how effective the UV irradiation was for these reported experimental results. We can use the definition of Z to extrapolate the survival fraction in a dose range where we expect the first order decay model to be valid. The figure below shows results for three of these table entries.

The Z-value for SARS-CoV-2 is only 24% of the Z-value for SARS-CoV-1. Why? These two viruses have very similar structures, and we would expect to see closer values. This is typical of inactivation literature values; there is a lot of scatter from different experimental configurations where the details are not always fully known.
Beggs and Avital report on a number of coronavirus studies and list known conditions for each study.

Using the single point method above, Beggs and Avital creates a table with Z-values.

The Bianco et al. (2020) study has the best (fastest) inactivation while the Darnell & Taylor (2006) has the worst (slowest) inactivation (this slow result appears to be a study on the addition of a protein to the growth media that inhibits inactivation).
We don’t know the conditions of all of these studies, but it is clear that there are considerable differences in the net amount of UVC irradiance reaching the viral DNA/RNA (or other sites where UV inactivation processes can occur).

As Bianco et al. states: “A better understanding of the effects of UVC on SARS-CoV-2, which take into account all the key factors involved in the experimental setting (including culture medium,"SARS-CoV-2 concentration, UVC irradiance [including wavelength], time of exposure, and UVC absorbance) will allow to replicate the results in other laboratory with different devices”. This statement about experimental rigor also applies to real life. UVC disinfection installations will have a wide range of real effectiveness depending on many variables and a conservative design approach is recommended.
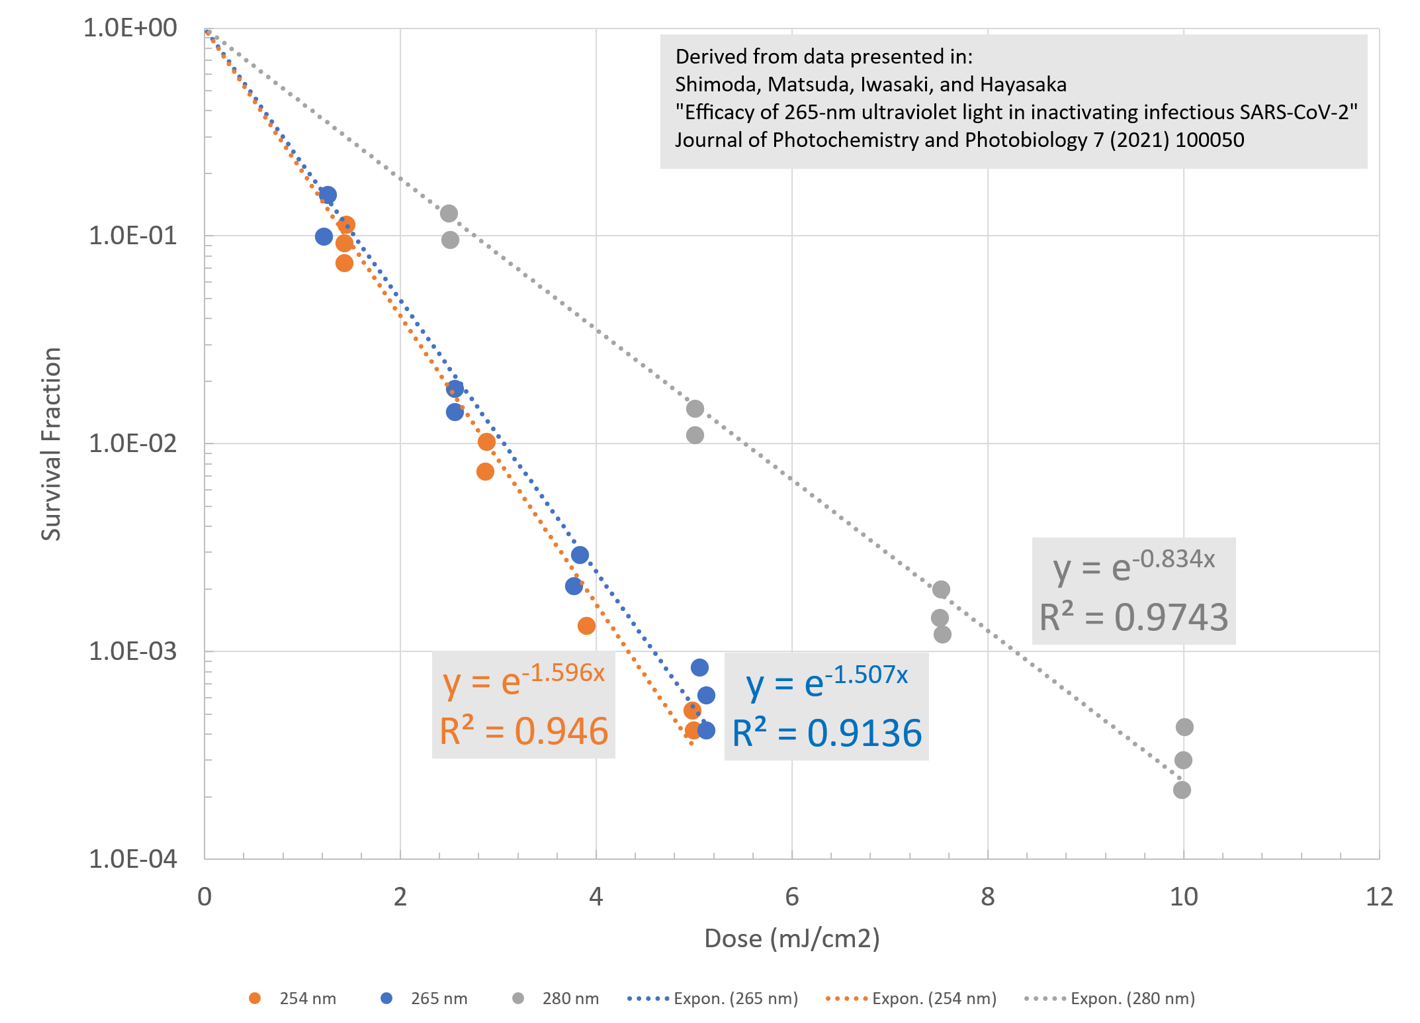
Another example of data in the literature that fits the Z-value first order decay model is found in Shimoda, Matsuda, Iwasaki, and Hayasaka. They studied the inactivation of SARS-CoV-2 as a function of wavelength. These Z-values are in cm2/mJ versus the m2/J units above. The conversion factor is 1 J/m2 = 0.1 mJ/ cm2 so 0.834 cm2/mJ is 0.0834 m2/J, etc.

Comparison of SARS-CoV-2 inactivation data for three different wavelengths fitted to a
Z-value first order model. The ratio between Z at 254nm and Z at 280 nm is 1.596/0.834 = 1.9 which is consistent with other estimates (~2) of the wavelength-fluence correction factor in the literature.
We can pull together these data using the Z-value to compare effectiveness. The table below shows a summary of published SARS-CoV-2 data.

Graphical representation of the table above. The numbers above the points are the corresponding 1log10 dose in mW/cm2.
The difference in the Inagaki et al. fast and slow results is an indication that the first order decay model does not hold for these particular data. A more complex model with two rate constants for fast and slow decay may be needed to fit these data. This type of model is discussed in Kowalski.
“In general, a small fraction of any microbial population is resistant to UVGI or other bactericidal factors (Cerf 1977, Fujikawa and Itoh 1996, Whiting 1991). Typically, over 99% of the microbial population will succumb to initial exposure but a remaining fraction will survive, sometimes for prolonged periods (Smerage 1993, Qualls and Johnson 1983). This effect may be due to clumping (Moats et al 1971, Davidovich and Kishchenko 1991), dormancy (Koch 1995), or other factors.”
If a two-step model is found to be needed to fit the entire range of the Inagaki data, we would use the fast Z-value and disregard the slow Z-value to construct a first order Z-value model with a note that it is only valid up to around log2.5 dose levels (I used Table 1 in Inagaki et al. to estimate log2.5).
Addendum (2/10/22) - This article (UV-C Intensity, Time and Total Dose Germicidal Efficacy) just showed up in my email. It has a good description of the experimental design for a UV disinfection study and the conclusions are consistent with a first-order decay model.
Follow on article - https://luminusdevices.zendesk.com/hc/en-us/articles/4442820589837-What-are-Air-Changes-per-Hour-ACH-and-how-do-they-relate-to-UV-disinfection-in-Building-Ventilation-Systems-
-----------------------------------------------------------------------------------------------------------------
These links and data are being provided as a convenience and for informational purposes only; they do not constitute an endorsement or an approval by Luminus of any of the products, services or opinions of the corporation or organization or individual. Luminus bears no responsibility for the accuracy, legality or content of the external site or for that of subsequent links. Contact the external site for answers to questions regarding its content.
------------------------------------------------------------------------------------------------------------------
Luminus Website https://www.luminus.com/
Luminus Product Information (datasheets): https://www.luminus.com/products
Luminus Design Support (ray files, calculators, ecosystem items: [power supplies, lenses, heatsinks]): https://www.luminus.com/resources
Luminus Product Information sorted by Applications: https://www.luminus.com/applications
Where to buy Samples of Luminus LEDs: https://www.luminus.com/contact/wheretobuy.
--------------------------------------------------------------------------------------------------------------------
Technical Support Contact Information: techsupport@luminus.com
Sales Support Contact Information: sales@luminus.com
Customer Service Support Contact Information: cs@luminus.com

Comments
0 comments
Please sign in to leave a comment.